Monitoring and usage
Renta provides powerful tools for tracking your pipelines' health and controlling credit consumption in real-time. The monitoring system allows you to react quickly to issues, optimize performance, and manage resources effectively.
Pipeline performance
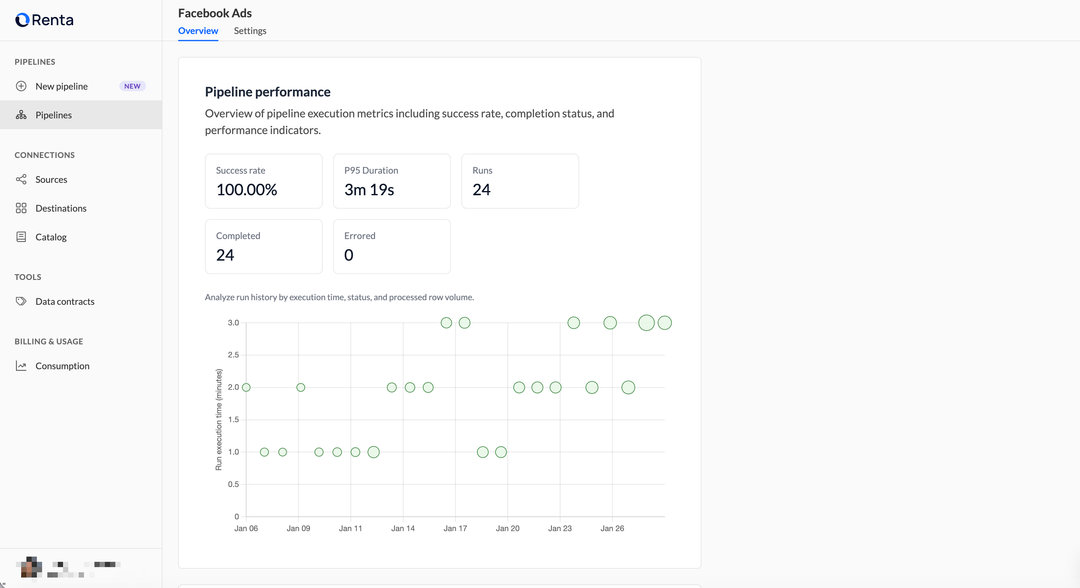
Detailed performance metrics are available on the Overview tab of each specific pipeline.

Core metrics
The pipeline overview displays key performance indicators that help you assess reliability and execution speed. These metrics provide at-a-glance insights into your pipeline's health.
Success rate
Shows pipeline reliability. It is calculated as the ratio of successfully completed runs to the total number of runs.
Interpretation:
| Success rate | Status |
|---|---|
| 100% | Ideal — all runs completed successfully |
| 95-99% | Stable — rare errors, acceptable performance |
| 90-94% | Needs attention — recurring issues detected |
| < 90% | Critical — requires immediate investigation |
P95 Duration
This metric excludes the slowest 5% of runs (outliers), providing a realistic estimate of execution time.
Practical application: If your P95 Duration is 2 minutes and the run is scheduled every 5 minutes, it is safe. If the execution time approaches the run interval, there is a risk of overlapping processes.
Run statistics
These counters track the execution history of your pipeline. Use them to identify patterns in failures and understand overall activity levels.
| Metric | Description | Importance |
|---|---|---|
| Runs | Total number of pipeline runs | Activity indicator |
| Completed | Number of successful completions | Reliability indicator |
| Errored | Number of runs with errors | Signal of underlying issues |
Run details
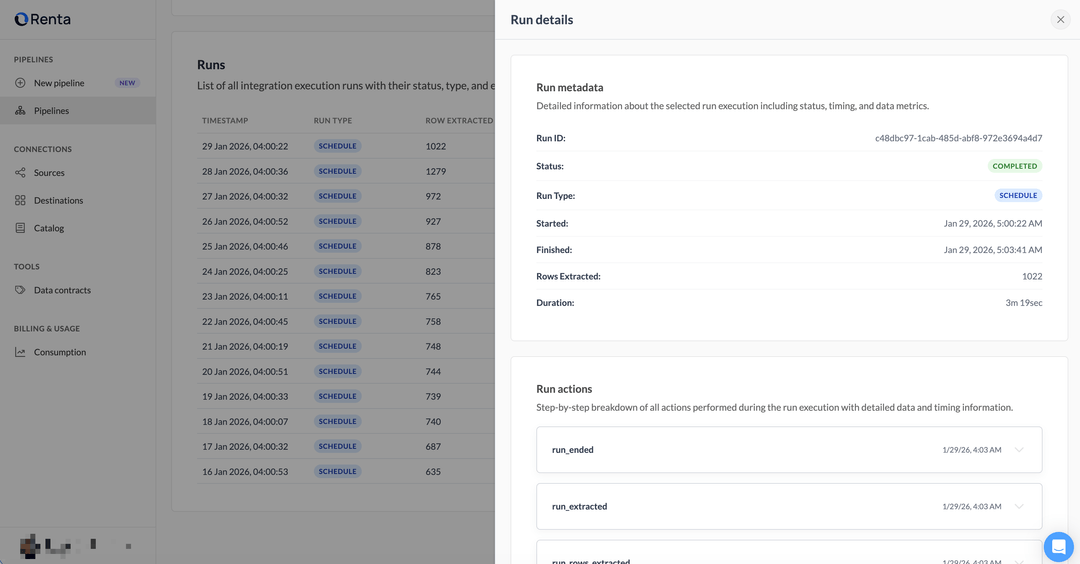
For a deep dive into a specific execution, use the Run details sidebar. To open it, click on any row in the Runs table on the pipeline page.

Run metadata
The Run metadata section contains technical information about the execution:
| Field | Description |
|---|---|
| Run ID | Unique identifier (used for debugging and API) |
| Status | Current status (Completed, Failed, Running, Queued, Cancelled) |
| Run Type | Trigger method: schedule (automated) or manual (user-triggered) |
| Rows Extracted | Number of rows processed in this run |
| Duration | Exact execution time |
Run actions
The Run actions section shows the step-by-step lifecycle of the execution. Each action contains variables (Action variables) with precise event timestamps. Events are streamed in real-time, making it convenient for monitoring and debugging active runs.
Key events:
| Event | Description |
|---|---|
| run_created | Run initiated in the system |
| run_queued | Waiting in the queue |
| run_started | Data extraction began |
| run_rows_extracted | Number of extracted rows recorded (reported for each batch, typically 10,000 rows per batch) |
| run_extracted | All data extracted from source, loading to data warehouse begins |
| run_ended | Execution completed |
Consumption
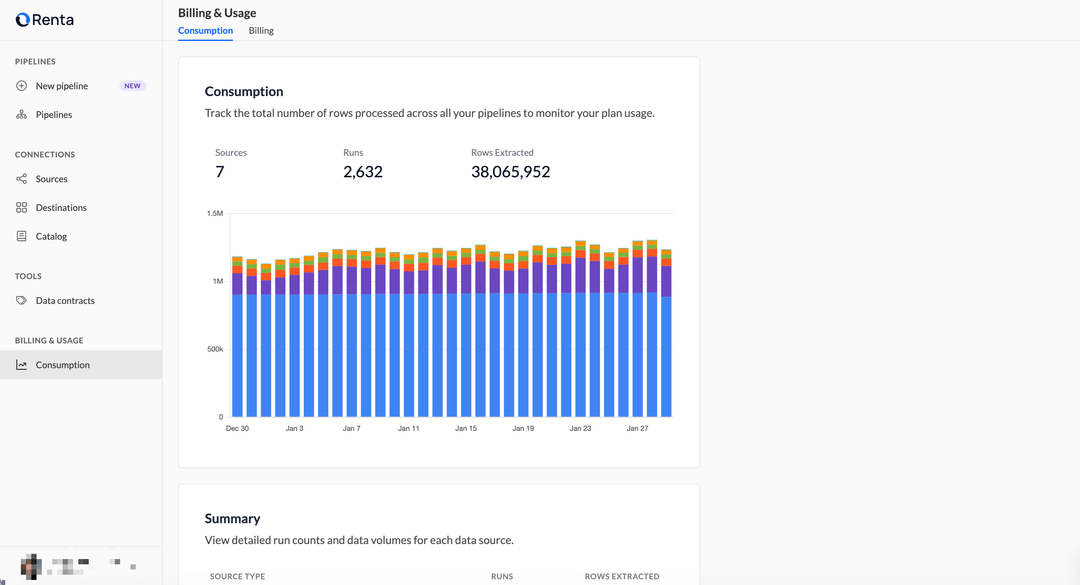
The Consumption page is the central hub for tracking your billing plan usage. Here, you can see the volume of data processed by all your pipelines.
To access the page, select Consumption from the sidebar menu.

Key metrics
The page displays three main metrics that characterize the scale of your infrastructure:
| Metric | Description | Why it matters |
|---|---|---|
| Sources | Number of active data sources | Understanding infrastructure scale |
| Runs | Total number of pipeline runs over the period | Tracking activity and load |
| Rows Extracted | Total number of processed rows | Controlling billing plan quota usage |
Consumption chart
The chart shows the dynamics of data processing by day. Each data source is highlighted with a unique color, allowing you to visually assess each process's contribution to overall consumption.
Analyzing the chart helps identify:
- Peak activity days with maximum load.
- Consumption trends (growth or decrease in data volume).
- Unexpected activity spikes.
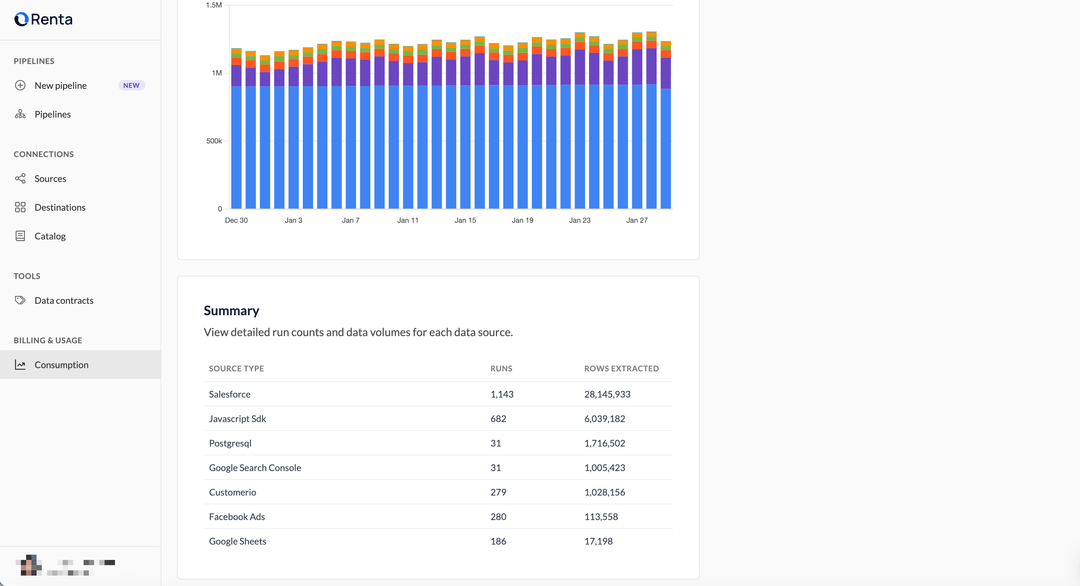
Summary table
The Summary table provides detailed information for each type of data source:

The table contains the following columns:
| Column | Description | Example |
|---|---|---|
| Source Type | Data source type (Javascript SDK, GA4, SQL, etc.) | Google Sheets |
| Runs | Number of pipeline runs for this type | 29 |
| Rows Extracted | Number of rows processed from the source | 58 |
Glossary
Key terms used throughout this documentation:
| Term | Definition |
|---|---|
| Pipeline | A configured process for transferring data from a source to a destination |
| Run | A single execution of a pipeline (manual or scheduled) |
| Rows Extracted | The number of rows extracted during a single run |
| Quota | The row processing limit within your billing plan |
| SLA | Service Level Agreement (e.g., data delay no more than 1 hour) |
Ready to get started?
Build your data pipeline today or get a personalized demo. Start free!
Need help?
Get expert support to ensure your project succeeds. We're here to help!
Feature requests?
Help shape our product! Share your ideas for new features and integrations.