
Basic ecommerce tools only collect information about completed purchases. It sounds like a good idea, but this approach is a classic “survivor’s mistake.” We know how our customers behave, but we don’t understand why other visitors leave without a purchase and how many of them there are. So, we constantly lose money and we do not understand at what point we do so.
Enhanced Ecommerce allows you to track and analyze the user’s passage of the sales funnel on the site. That means that with Google Analytics you can analyze:
Which product cards visitors view;
What steps of placing an order were made by the visitor;
At what stage do people leave the site;
What product is added to the basket;
Which products are removed from the basket most often;
What options for placing an order are preferred by the target audience (type of delivery, payment method, etc.).
Overall, this gives us three main benefits, for which we need to master the tools of advanced e-commerce:
You will receive data on the full sale cycle of your site. Learn the behavior of your audience, from entering the site to checkout.
You can evaluate the effectiveness of the “sales funnel” on the site and identify weaknesses.

Start storing this data in a convenient Google Analytics group of reports and Google BigQuery, ready for further processing.


You can set up Enhanced E-commerce information collection in Google Analytics using the Google Tag Manager.
Table of contents
Why did we choose Google Tag Manager
There are three reasons why we use Google Tag Manager to implement Enhanced E-commerce.
Google Tag Manager gives you access to fine-tuning. We can configure the receipt of information only from certain pages or activate tags only with certain user actions on the site.
Convenient data debugging. The analyst can check the data for errors in the preview mode and check the form they are transmitted into Google Analytics;
After setting up advanced e-commerce through Google Tag Manager, Enhanced E-commerce data can be transferred to other systems. For example, transaction data in Facebook Ads or Criteo.
Setting up Google Analytics Enhanced Ecommerce with Google Tag Manager
To implement Enhanced E-commerce through the Google Tag Manager tools, you need to solve three problems:
Enable Enhanced E-commerce in the Google Analytics settings;
Configure the transfer of information to the DataLayer. DataLayer is a JavaScript code that contains ecommerce data. This task requires programming knowledge; it is usually done by a team of web developers based on the technical task of an analyst;
Configure tags in Google Tag Manager so that they gather information from DataLayer and transfer them to Google Analytics.
We will analyze all of this now, starting with the simplest things and ending with all the details of advanced e-commerce settings.
Turning Enhanced Ecommerce on in Google Analytics
First of all, you need to activate the advanced ecommerce reports in Google Analytics itself. Go to the Admin- View - Ecommerce Settings .section and turn on the report button in the e-commerce settings of the selected view.

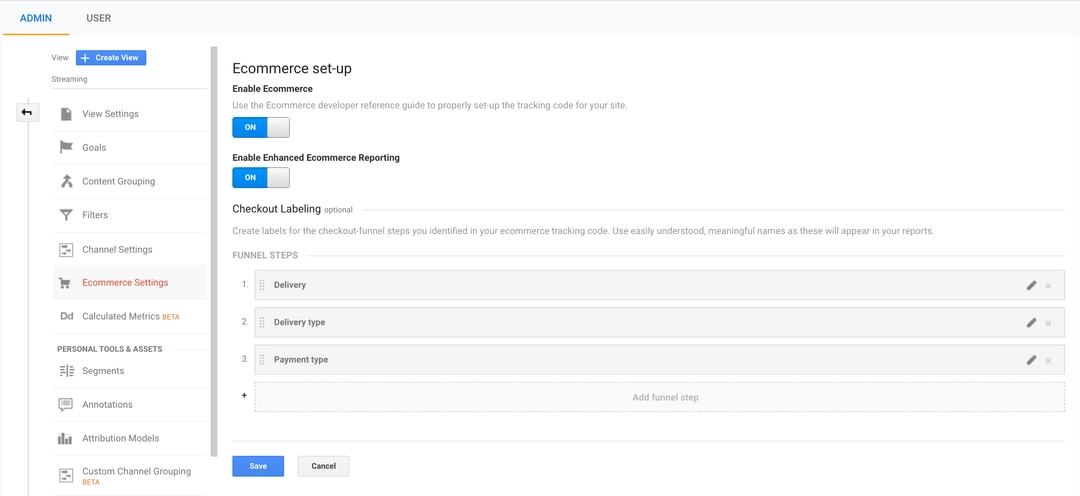
At this point, the first stage of tuning is completed, and you can proceed to more serious tasks.
Preparing a technical task for developers to implement the Enhanced E-commerce code on the site and configuring tags directly in the Google Tag Manager.
Let’s analyze each block separately.
Product Impressions
The indicator of product displays in catalogs gives us knowledge about how many times a product has been shown to visitors as part of lists, categories, and sections.

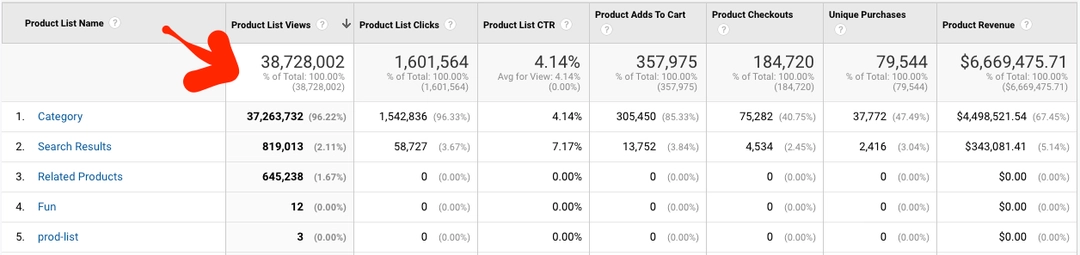
It is very important to configure the reception of data on this parameter in order to understand the interests of your audience: what lists it form, which group of products the audience is interested in, what product parameters are of paramount importance to your audience.
You can configure the transmission of the total number of impressions, which is read by the trigger when a visitor visits the product page.
You can only send data about products that were in the visible area of the screen.
The choice depends on the specific technical task that the analyst should draw up, and on the specific goals that the study of site traffic should solve.
To track these parameters, you must embed the following type of code in your JS site:
<script>
  window.dataLayer = window.dataLayer || [];
  dataLayer.push({
    event:'ProductImpressions',
    ecommerce: {
      impressions: [{ //first product
          name: 'iPhone XS Max', //product name
          id: 'A123', //product article
          price: 999.00, //unit price
          category: 'Smartphone', //product category
          brand: 'Apple', //product brand
          list: 'iPhones', //list name
          position: 1 //position of a product in the list
        }, { //second product
          name: 'iPhone X',
          id: 'A124',
          price: 1099.00,
          category: 'Smartphone',
          brand: 'Apple',
          list: 'iPhones',
          position: 2
        }
        //more details about the product
      ]
    }
  });
<script>
Let’s analyze the variables that are used in the code:
| # | Key name | Descriptions |
|---|---|---|
| 1 | name | the name of the product |
| 2 | id | the product id; |
| 3 | price | the price of the product |
| 4 | category | the product category |
| 5 | brand | the product brand |
| 6 | variant | the modification, version of the product |
| 7 | list | version of the list in which the product is added / list in which the product was located |
| 8 | position | the position of the product in the list |
After the JS code is displayed on the site, you can proceed to configure the transfer of this data to Google Analytics through the Google Tag Manager.
You can transfer data from DataLayers using variables in GTM. In our example, we are transferring the list name to the Event Label.
To do this, you need to create the datalayer variable and specify the path to the required data. For example, to get the name of the sheet in which the product was shown, specify ecommerce.impressions.list. Simo Ahava has greatly described how to extract datalayer values in his blog.
To configure data transfer to Google Analytics, you need to:
Create a tag of the Universal Analytics type:
![]()
Tracking Type: Event
Event Category: Enhanced Ecommerce Events
Event Action: Product Impressions
Event Lable: List name:{{ecommerce.impressions.list}}
To activate a tag, you need to create a trigger with the following settings:

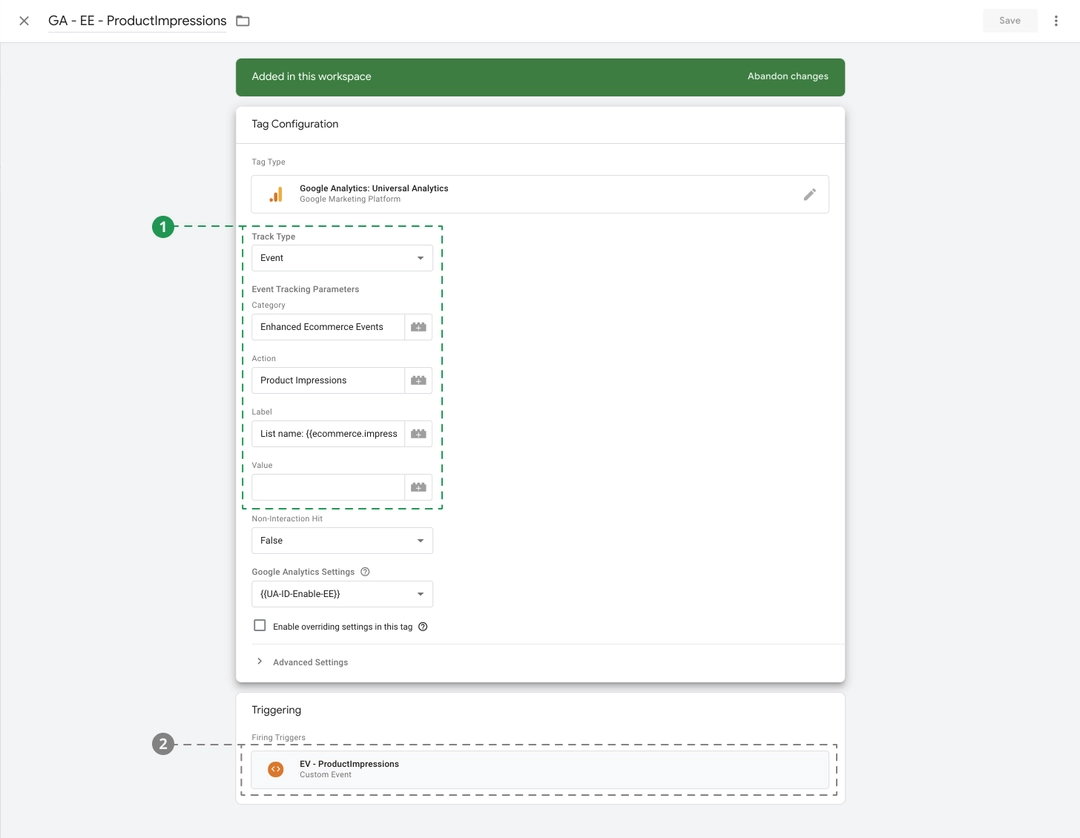

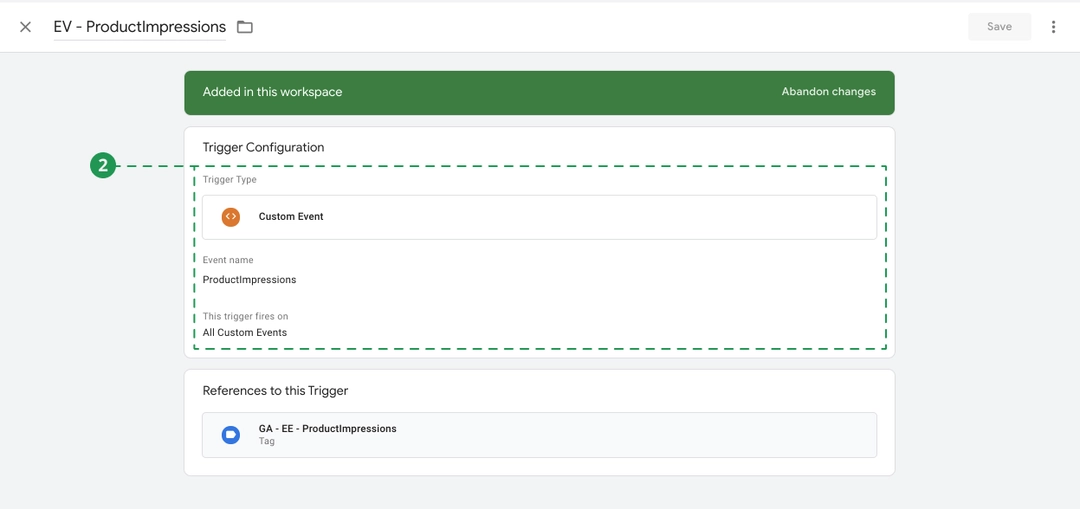
Trigger Type: Custom Event
Event name: ProductImpressions (note that this particular event was registered in the JS code).
Now the data will be collected in the DataLayer and from there, using Google Tag Manager, it will be transferred to Google Analytics.
Product Clicks
Closely related to the impression metric is the clickthrough rate for products in the listings. It helps to determine the most popular products in each category, as well as to understand how effective and relevant existing lists are in principle.
When you click on a product, you must use the code:
<script>
  window.dataLayer = window.dataLayer || [];
  dataLayer.push({
    event: 'productClick',
    ecommerce: {
click: {
      actionField: {
        list: 'Phones' //name of the list from which a user clicked on a product
      },
      products: [{ //a product on which a user clicked
        id: 'A123', //an article of the product on which a user clicked
        name: 'iPhone XS Max',
        price: 999.00,
        brand: 'Apple',
        category: 'Smartphone',
        position: 3 //position of a product in the list
      }]
    }
    }
  });
</script>
The code contains similar variables. Let’s analyze the variables that are used:
| # | Key name | Descriptions |
|---|---|---|
| 1 | name | the name of the product |
| 2 | id | the product id; |
| 3 | price | the price of the product |
| 4 | category | the product category |
| 5 | brand | the product brand |
| 6 | variant | the modification, version of the product |
| 7 | list | version of the list in which the product is added / list in which the product was located |
| 8 | position | the position of the product in the list |
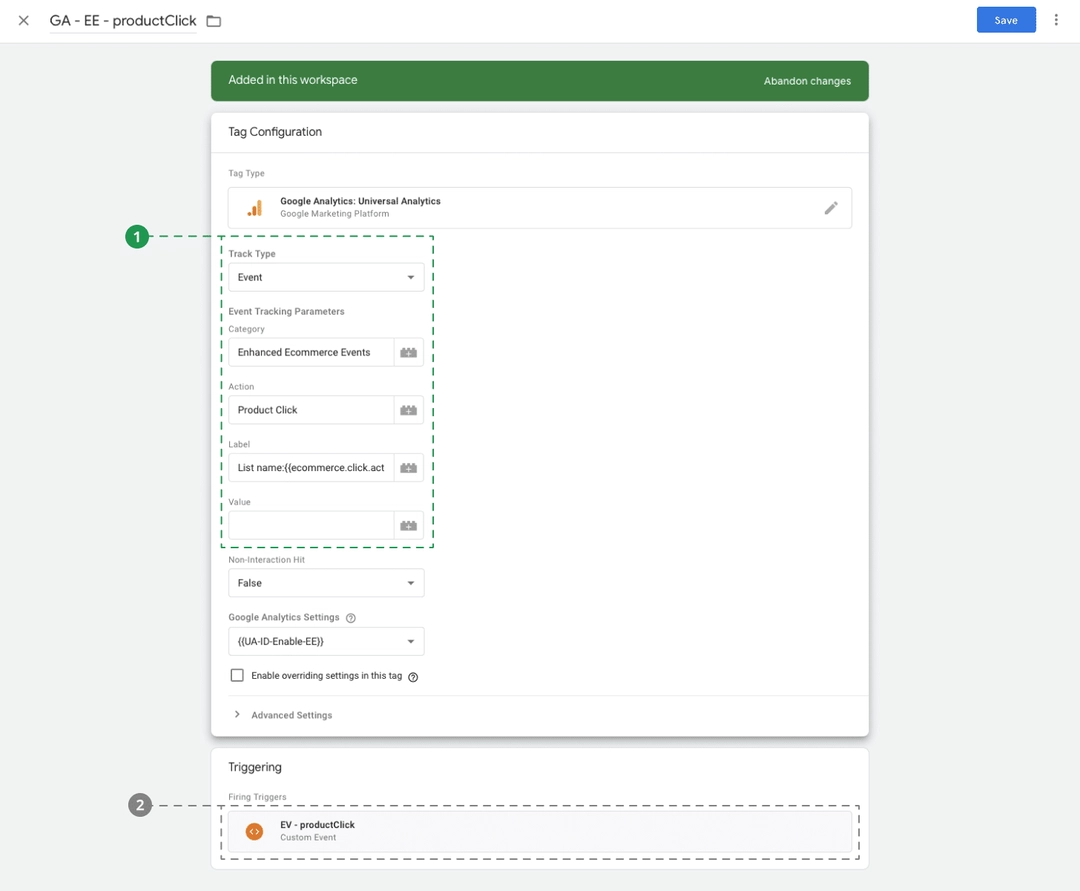
After the JS code is displayed on the site, you can proceed to configure the transfer of this data to Google Analytics through the Google Tag Manager. For this:
Create a tag of the Universal Analytics type:
![]()
Tracking Type: Event
Category: Enhanced Ecommerce Events
Action: Product Clicks
Lable: List name: {{ecommerce.click.actionField.list}}
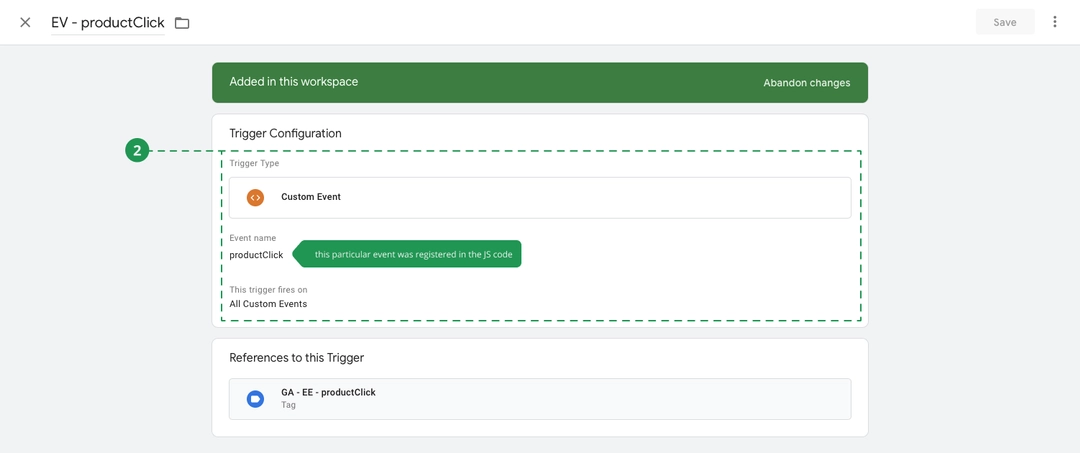
To activate the tag, you must create a trigger with the following settings:
![]()
Trigger Type: Custom Event
Set the productClick condition as the name of the event (note that this particular event was registered in the JS code).


Views of Product Details
Information on product card views is one of the steps in the sales funnel and can provide a lot of food for thought.
The conversion rate of transitions from the product’s card to the addition to the basket is studied in detail. If the conversion is low, then the product does not meet the expectations of customers, or information about it is incomplete and needs to be developed further. Perhaps the UI is not developed well enough – the Buy button is too unnoticeable. Or there was a technical problem, and adding the product to the basket does not work at all.
When a person goes to the product page, JavaScript is triggered, which must be embedded in the site code:
<script>
  window.dataLayer = window.dataLayer || [];
  dataLayer.push({
    event: 'productDetail',
    ecommerce: {
      detail: {
        actionField: {list: 'Phones'}, //a list from where a product was opened.
        products: [{
          name: 'iPhone XS Max',
          id: 'A123',
          price: 999.00,
          brand: 'Apple',
          category: 'Smartphone',
          variant: 'Gold'
        }]
      }
    }
  });
</script>
We have already analyzed most of the variables in the previous tool. The only thing added actionField. Variables:
| # | Key name | Descriptions |
|---|---|---|
| 1 | actionField | the list from which the product was opened |
| 2 | name | the name of the product |
| 3 | id | the product id; |
| 4 | price | the price of the product |
| 5 | category | the product category |
| 6 | brand | the product brand |
| 7 | variant | the modification, version of the product |
| 8 | list | version of the list in which the product is added / list in which the product was located |
| 9 | position | the position of the product in the list |
In addition to data on viewing a product’s card, it is possible to collect information on viewing additional products (in case of cross-selling, promotions with a gift or Upsell or Downsell advertising campaign on the product’s card).
Also, the click rate for goods, which we also analyzed above, is inextricably linked with this indicator. Remember that it passes the same information to Google Analytics, but also takes into account the position of products in the list (Product Clicks).
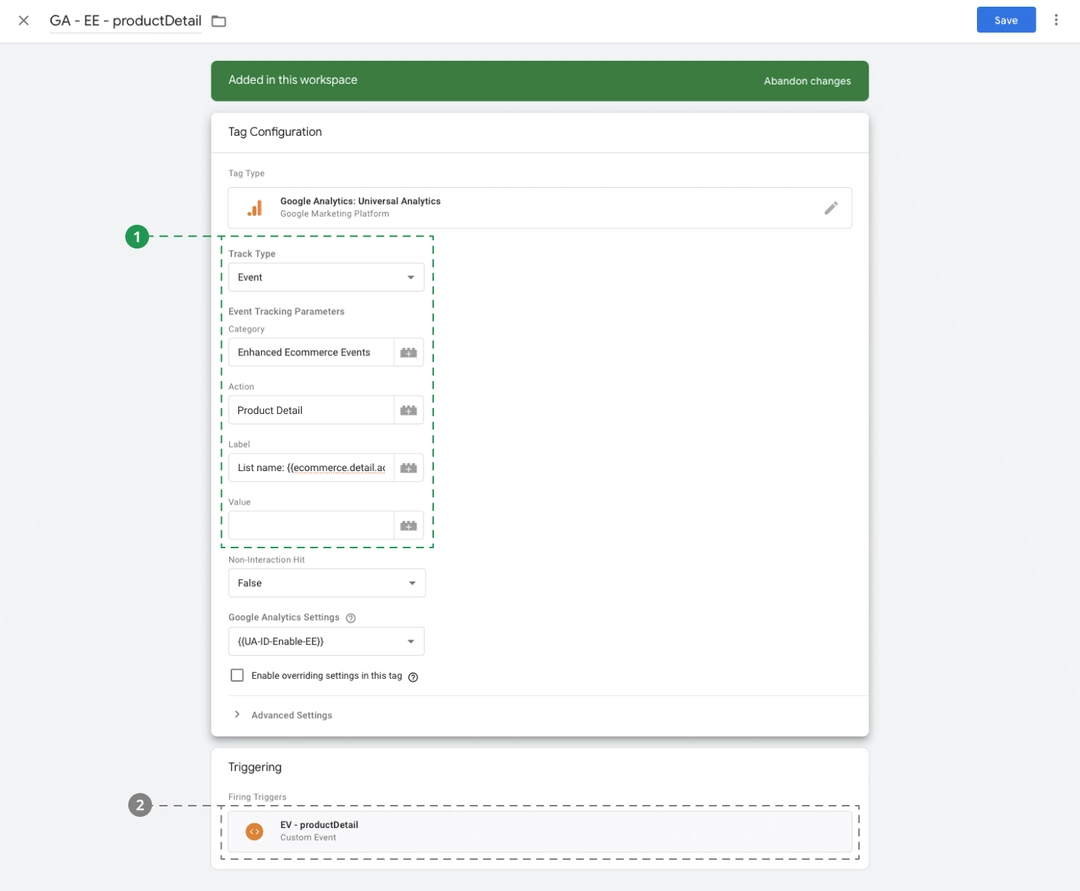
After the JS code is displayed on the site, you can proceed to configure the transfer of this data to Google Analytics through the Google Tag Manager. To do this:
Create a tag of the Universal Analytics type;
![]()
Tracking Type: Event Event
Category: Enhanced Ecommerce Events
Action: Product Detail
Label: List name: {{ecommerce.detail.actionField.list}}
To activate a tag, you need to create a trigger with the following settings:
![]()
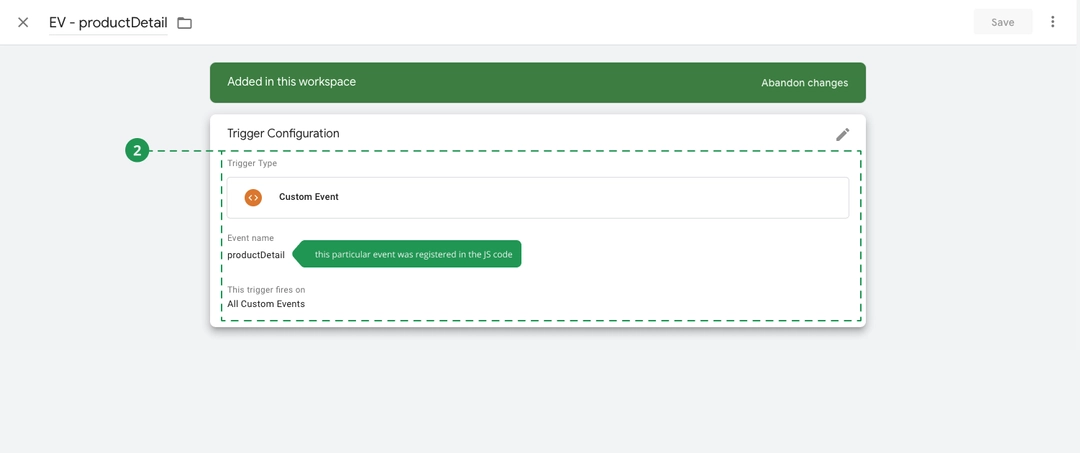
Trigger Type: Custom Event
Set the condition name as the event name productDetail (note that this particular event was registered in the JS code).
Adding a Product to a Product Cart
Adding a product to the basket is one of the most important parameters, as it shows a high degree of user interest not only in the product, but also in your price offer.
Depending on the complexity of the online store, the user may have several options for adding goods to the basket: from the product card, from lists, or recommendation blocks (for example, a list of related products). Analytics should consider all of the options for adding a product to the basket to show which of the site’s blocks is better and generates more sales. Maybe your customers only buy products from a specific list or promotion section?
To do this, you need to embed the following script in the site code:
<script> window.dataLayer = window.dataLayer || []; dataLayer.push({ event: 'addToCart', ecommerce: { add: { actionField: {list: 'Phones'}, products: [{ name: 'iPhone XS Max', id: 'A123', price: 1099.00, brand: 'Apple', category: 'Smartphone', variant: 'Gold', quantity: 1 //the number of added product }] } } });</script>Variables in code:
| # | Key name | Descriptions |
|---|---|---|
| 1 | name | the name of the product |
| 2 | id | the product id; |
| 3 | price | the price of the product |
| 4 | category | the product category |
| 5 | brand | the product brand |
| 6 | variant | the modification, version of the product |
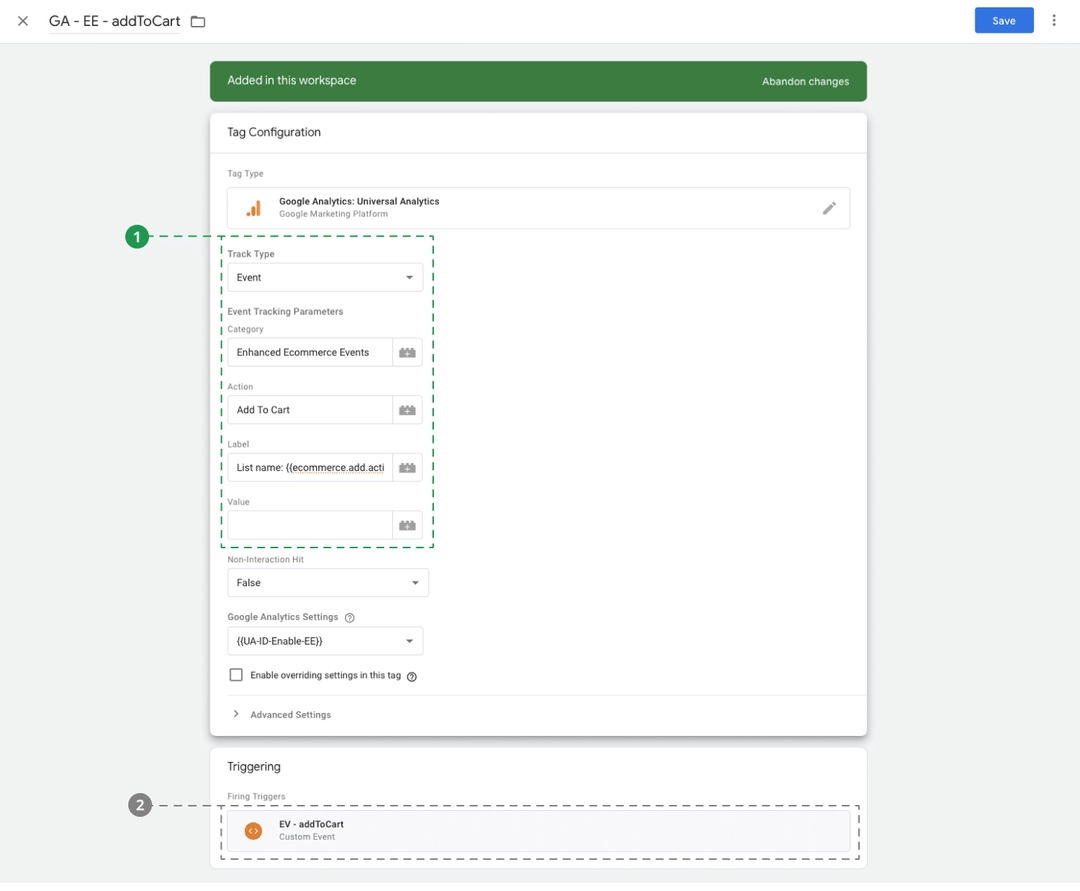
After the JS code is displayed on the site, you can proceed to configure the transfer of this data to Google Analytics through the Google Tag Manager. In order to do this:
Create a tag of the Universal Analytics type
![]()
Tracking Type: Event
Category: Enhanced Ecommerce Events
Action: Add to Cart
Label: List name: {{ecommerce.add.actionField.list}}
To activate a tag, you need to create a trigger with the following settings:
Trigger Type: Custom Event
![]()
Set the condition name as the event name addToCart (note that this particular event was registered in the JS code).
Now the data will be collected in the DataLayer and from there, using Google Tag Manager, it will be transferred to Google Analytics.
Removing a Product from a Product Cart
n addition to adding goods to the basket, you can also record cases of removal of goods from the basket. These data are not directly useful, however, an Internet marketer may be wondering if the buyer remains on the site after the removal of the goods. Also, perhaps the marketer will be able to trace the pattern in the removal of goods.
Example script for the site:
<script>
    window.dataLayer = window.dataLayer || [];
    dataLayer.push({
    event: 'removeFromCart',
    ecommerce: {
        remove: {
        actionField: {list: 'Phones'},
        products: [{
            name: 'iPhone XS Max',
            id: 'A123',
            price: 999.00,
            brand: 'Apple',
            category: 'Smartphone',
            variant: 'Gold',
            quantity: 1
        }]
        }
    }
    });
</script>
All variables have already been reviewed in previous tools:
| # | Key name | Descriptions |
|---|---|---|
| 1 | name | the name of the product |
| 2 | id | the product id; |
| 3 | price | the price of the product |
| 4 | category | the product category |
| 5 | brand | the product brand |
| 6 | variant | the modification, version of the product |
After the JS code is displayed on the site, you can proceed to configure the transfer of this data to Google Analytics through the Google Tag Manager. To do this:
Create a tag of the Universal Analytics type;
Tracking Type: Event
![]()
Category: Enhanced Ecommerce EventsAction: Remove from Cart
Label: List name: {{ecommerce.remove.actionField.list}}
To activate a tag, you need to create a trigger with the following settings:
![]()
Trigger Type: Custom Event
Set the condition name as the event name removeFromCart (note that this particular event was registered in the JS code).

Now the data will be collected in the DataLayer and from there, using Google Tag Manager, it will be transferred to Google Analytics.
Checkout Steps
Each online store has its own funnel for placing an order. For some, the order is divided into several separate steps. For example: authorization, choice of payment and delivery method. For others, all the data for placing an order is collected on one page.
Using the advanced Google Analytics tools, you can configure the tracking of each step of your own funnel and understand its effectiveness. That is, each completed stage of placing an order can be visualized as separate reports in Google Analytics.
Therefore, you can identify popular payment methods or identify a delivery problem for specific regions.
Example.
Authorization
Choosing the payment method
Choosing the delivery method
To track the achievement of each step, it is necessary to execute a fairly universal code, it only changes the identifier and description of a specific step.
Here’s an example for the commitment of the first step:
<script>
  window.dataLayer = window.dataLayer || [];
  dataLayer.push({
    event: 'checkout',
    ecommerce: {
      checkout: {
        actionField: {step: 1, //step number
                        option: 'DHL' //step value
                    },
        products: [{ //products from the basket
          name: 'iPhone XS Max',
          id: 'A123',
          price: 799.00,
          brand: 'Apple',
          category: 'Smartphones',
          variant: 'Gold',
          quantity: 1
        }]
      }
    }
  });
</script>
To commit passing the second step, update the step number and its description. Here’s an example (line 7-8):
<script>
  window.dataLayer = window.dataLayer || [];
  dataLayer.push({
    event: 'checkout',
    ecommerce: {
      checkout: {
        actionField: {step: 2, //step number
                        option: 'PayPal' //step value
                    },
        products: [{ //products from the basket
          name: 'iPhone XS Max',
          id: 'A123',
          price: 799.00,
          brand: 'Apple',
          category: 'Smartphones',
          variant: 'Gold',
          quantity: 1
        }]
      }
    }
  });
</script>
Here’s an explanation of the code variables:
| # | Key name | Descriptions |
|---|---|---|
| 1 | actionField | It contains two variables: step и option. The step is the number of a step in your funnel. The option is the description of a step (it is displayed in Google Analytics reports). |
| 2 | name | the name of the product |
| 3 | id | the product id; |
| 4 | price | the price of the product |
| 5 | category | the product category |
| 6 | brand | the product brand |
| 7 | variant | the modification, version of the product |
Then, configure data transmission via GTM:
Create a tag of the Universal Analytics type;
![]()
Tracking Type: Event
Category: Enhanced Ecommerce Events
Action: Checkout step: {{ecommerce.checkout.actionField.step}} Label: Checkout option: {{ecommerce.checkout.actionField.option}}
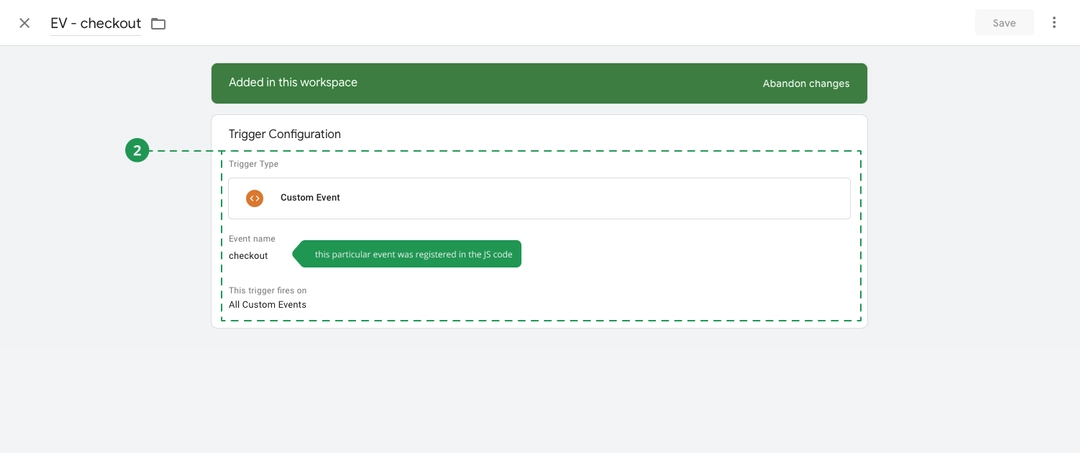
To activate a tag, you need to create a trigger with the following settings:
![]()
Trigger Type: Custom Event
Set the condition name as the event name checkout (note that this particular event was registered in the JS code).

Now the data will be collected in the DataLayer and from there, using Google Tag Manager, it will be transferred to Google Analytics.
As a final step, insert names of every step in the e-commerce configuration in Google Analytics. Please note that the number of every step corresponds to the step number in your JS code:
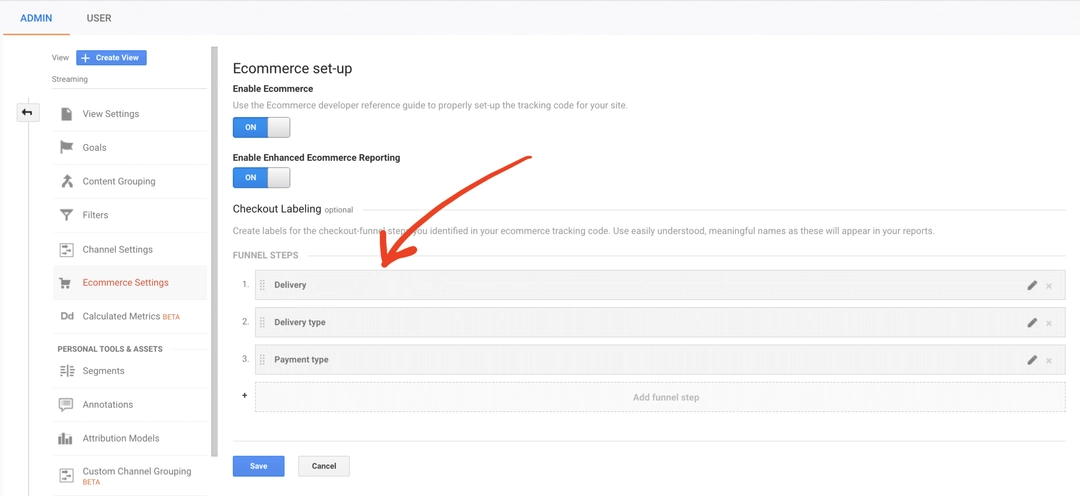
Go to Admin - View - Ecommerce Settings - Enable Ecommerce - Enable Enhanced Ecommerce Reporting in the settings of the Google Analytics view.
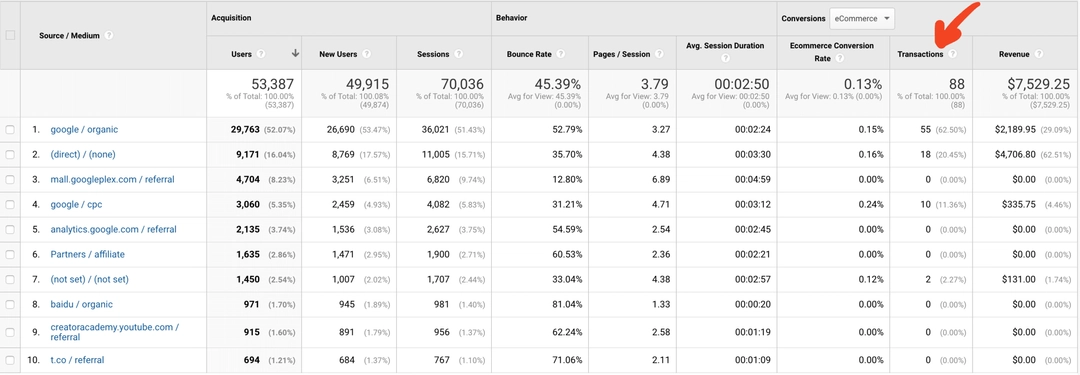
Purchases
Completed transactions is the most important metric of the Enhanced E-commerce module and displays the number of placed orders.

This code is executed when the user buys the goods, that is, at the time of successful validation of the order:
<script>
  window.dataLayer = window.dataLayer || [];
  dataLayer.push({
    event: 'transactionCompleted',
    ecommerce: {
    currencyCode: 'USD',
    purchase: {
      actionField: {
        id: '267519', // Transaction ID
        affiliation: 'Apple',
        revenue: 999.00, // transaction value (receipt total)
        tax: 0.00,
        shipping: 0.00  //delivery charge
      },
        products: [{ //products from a cart
          name: 'iPhone XS Max', //product name
          id: 'A123', //product id from the catalog
          price: 799.00, //product price
          brand: 'Apple', //brand of the product
          category: 'Smartphones', //product category
          variant: 'Gold', //color options: green, blue
          quantity: 1 //quantity of the product
        }]
      }
    }
  });
</script>
Variables:
| # | Key name | Descriptions |
|---|---|---|
| 1 | Id | Transaction Id |
| 2 | affiliation | A store or an affiliation where the transaction occurred. For example, Google Store. |
| 3 | revenue | Total revenue or aggregate transaction value |
| 4 | tax | The sum of all taxes associated with a transaction. |
| 5 | shipping | Delivery expenses associated with a transaction. |
| 6 | id | The product id; |
| 7 | price | The price of the product |
| 8 | category | The product category |
| 9 | brand | The product brand |
| 10 | variant | The modification, version of the product |
After the JS code is displayed on the site, you can proceed to configure the transfer of this data to Google Analytics through the Google Tag Manager.
To do this:
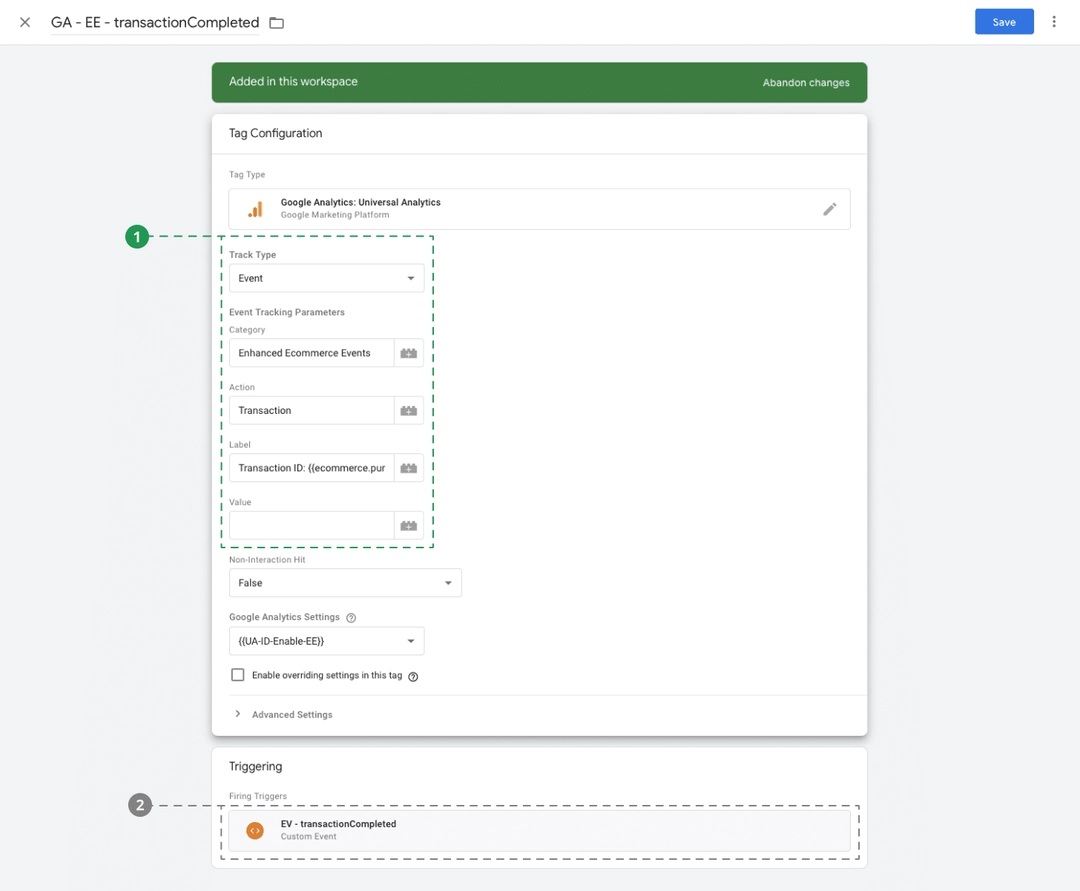
Create a tag of the Universal Analytics type;
![]()
Tracking Type: Event
Event Category: Enhanced Ecommerce Events
Event In Action: Transaction
Label: Transaction ID: {{ecommerce.purchase.actionField.id}}
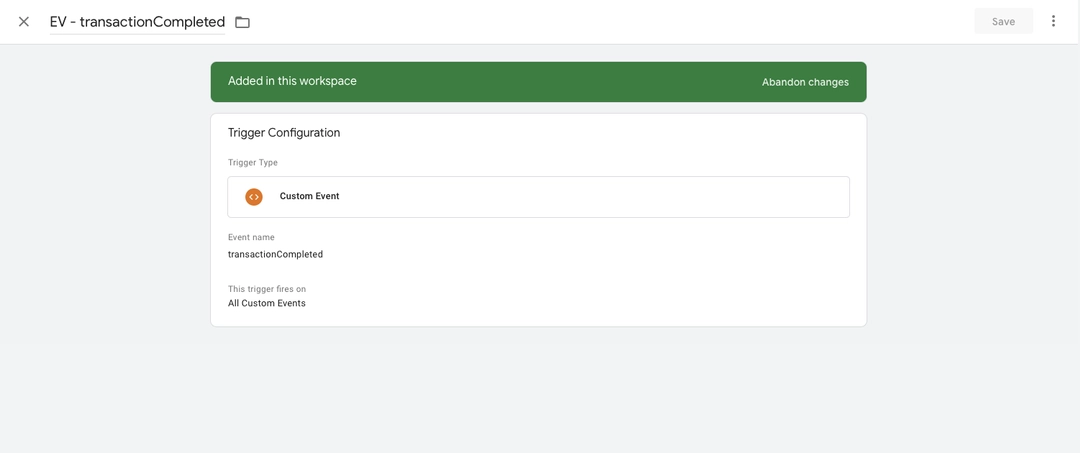
To activate a tag, you need to create a trigger with the following settings:
![]()
Trigger Type: Custom Event
Set the condition name as the event name transactionCompleted (note that this particular event was registered in the JS code).
Now the data will be collected in the DataLayer and from there, using Google Tag Manager, it will be transferred to Google Analytics.
Promotion Impressions
E-commerce projects often use showcases to display ads. For example, a banner about discounts or a new collection of clothes.
Banners are sometimes marked out with UTM parameters to enable tracking the effectiveness of internal advertising, which is a mistake. Indeed, in this case, we lose the referral source (it changes to the value from the UTM parameter).
The Internal Promotion report allows you to solve the issue of evaluating the effectiveness of internal advertising providing the following data:
The number of impressions of advertising banners
The number of clicks on them
CTR
The number of transactions where there was a click on advertising materials.
You need to implement the following script to the website structure to track advertising impressions:
<script>
  window.dataLayer = window.dataLayer || [];
  dataLayer.push({
    event: 'promotionView',
    ecommerce: {
      promoView: {
        promotions: [
          {
            id: 'buy_iphone/iphone_xs',
            name: 'Buy iPhone XS and iPhone XS Max - Apple',
            creative: 'Banner 123',
            position: 'Slot 1'
          }, {
            id: 'buy_iphone/iphone_xr',
            name: 'Buy iPhone XR and iPhone XR Max - Apple',
            creative: 'Banner iPhone XR',
            position: 'Slot 2'
          }
        ]
      }
    }
  });
</script>
If a slider is used when displaying banners, then in such cases you need to call the code of the displayed slide at the time of its change, and not to call the code immediately for all slides while the page is loading.
After the JS code is executed on the website, you can proceed to configure the transfer of this data to Google Analytics through Google Tag Manager. To do this:
Create a tag of the Universal Analytics type
![]()
Tracking Type: Event
Category: Enhanced Ecommerce Events
Action: Promotion Impressions
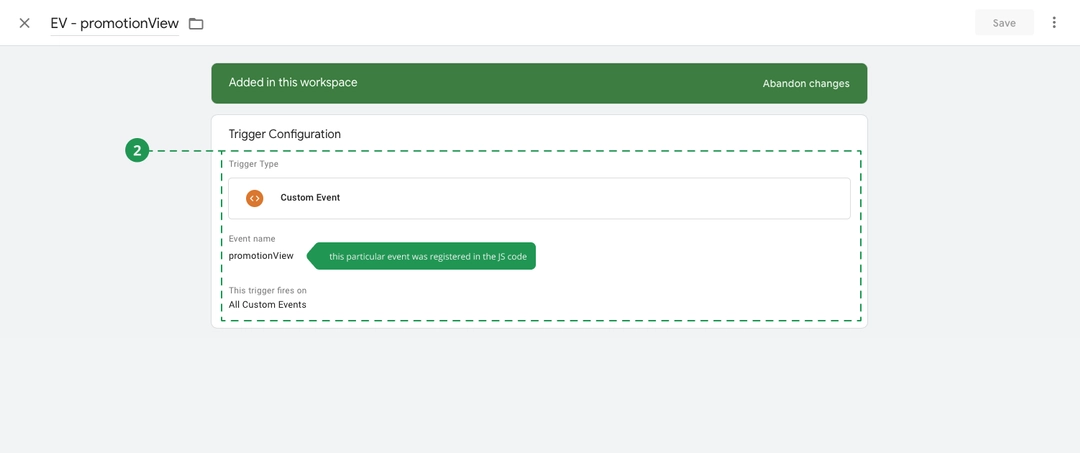
To activate a tag, you need to create a trigger with the following settings:
![]()
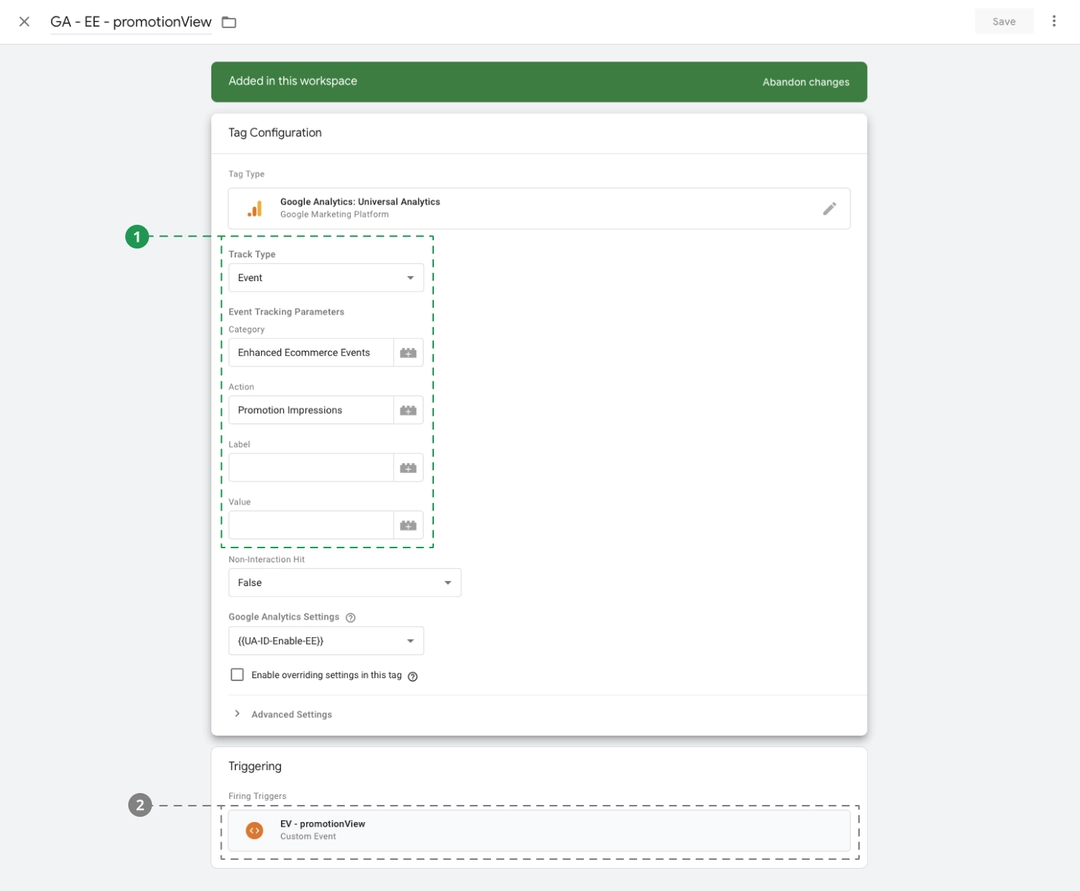

Trigger Type: Custom Event
Set the condition name as the event name promotionView (note that this particular event was registered in the JS code).
Now the data will be collected in the DataLayer and from there, using Google Tag Manager, it will be transferred to Google Analytics.
Promotion Clicks
Internal advertising in the online store helps to retain the user and increase the average purchase bill. Naturally, the effectiveness of advertising is also possible and even needs to be measured. To do this, we have the Promotion Clicks tool, which allows you to track clicks on internal advertising.
When you click on the banner, you must use the following code:
<script>
    window.dataLayer = window.dataLayer || [];
    dataLayer.push({
    event: 'promotionClick',
    ecommerce: {
        promoClick: {
        promotions: [{
            id: 'id1',
            name: 'Buy iPhone XS and iPhone XS Max - Apple',
            creative: 'Banner 123',
            position: 'Slot 1'
        }]
        }
    }
    });
</script>
Please note that the parameters correspond to the code with the banner display so that you can analyze not only the effectiveness of the place for internal advertising, but also track the effectiveness of the breakdown by various advertising campaigns.
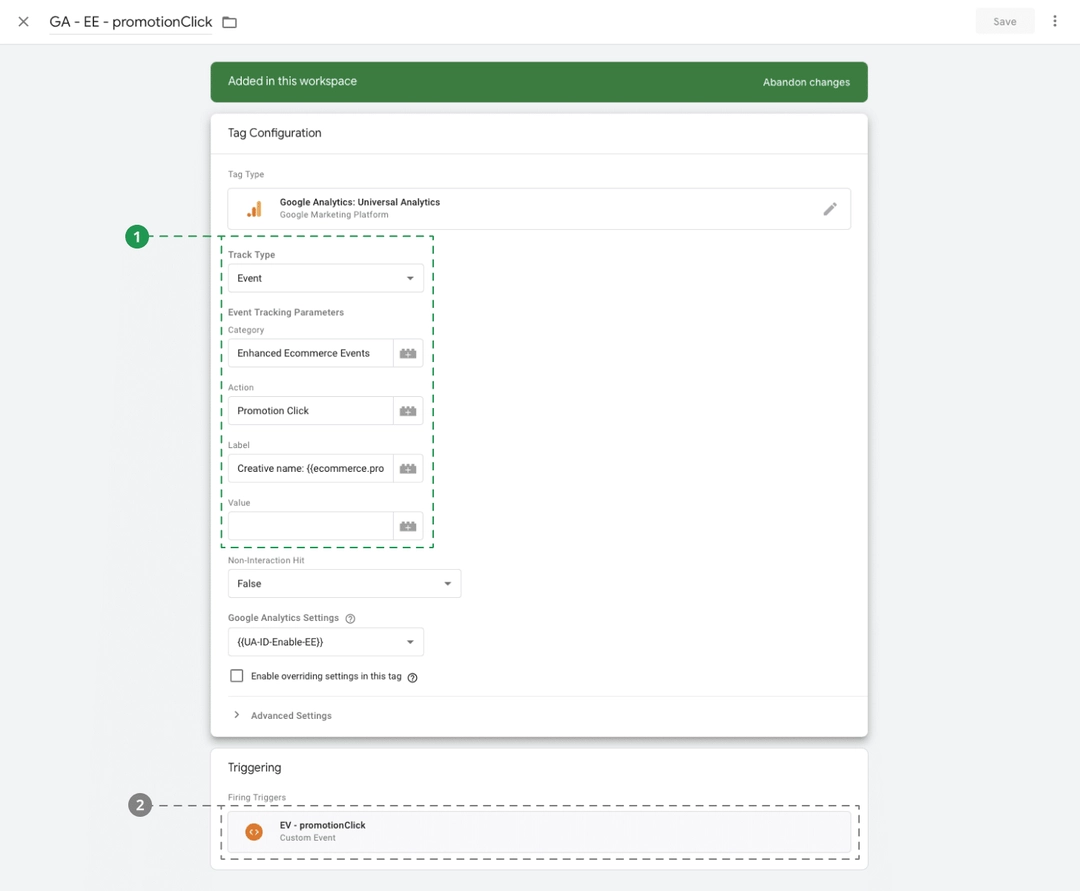
Create a tag of the Universal Analytics type
![]()
Tracking Type: Event
Category: Enhanced Ecommerce Events
Action: Promotion Click
Label: Creative name: {{ecommerce.promoClick.promotions.0.creative}}
To activate a tag, you need to create a trigger with the following settings:
![]()
Trigger Type: Custom Event
Set the condition name as the event name promotionClick (note that this particular event was registered in the JS code).

Now the data will be collected in the DataLayer and from there, using Google Tag Manager, it will be transferred to Google Analytics.
Custom Dimensions and Metrics in Enhanced E-commerce Code
As you can see, advanced ecommerce tools work very well with a group of predefined values and metrics that represent information about products sent to Google Analytics (product name, identifier, brand, price).
But what if you want to send the information that is not described by any variable by default?
This is where Custom Dimensions and Metrics come to the rescue. This is an effective way to collect additional data that Google Analytics does not collect by default.
An example of custom values can be anything that is associated with a product or a sales process and can become part of marketing research. For example: the quantity of goods in the basket or the method of placing an order (quick or issued through the basket).
Types of custom values
As we mentioned above, there are two types of custom dimensions: dimensions and metrics. Let’s look at the difference between these data types.
Parameters are the data that we see in the rows of the Google Analytics reports. For example, clothing style (office, casual), color or size. Any values can be set; they are determined by the marketer conducting the research.
Metrics are the numeric values of custom value strings in reports. For the values clothing style, color or size, the metric will be the number of goods added to the basket, the share of one of the product groups in the total revenue, profit, etc.
Metrics can also be different and they are only limited by the initial array of data collected on the website.
How to set up custom value transfer
First of all, you need to configure user settings in the settings of Google Analytics. To do this, go to Admin - Property, and depending on the task, select Custom Dimension or Custom Metric. Select the product as the scope.

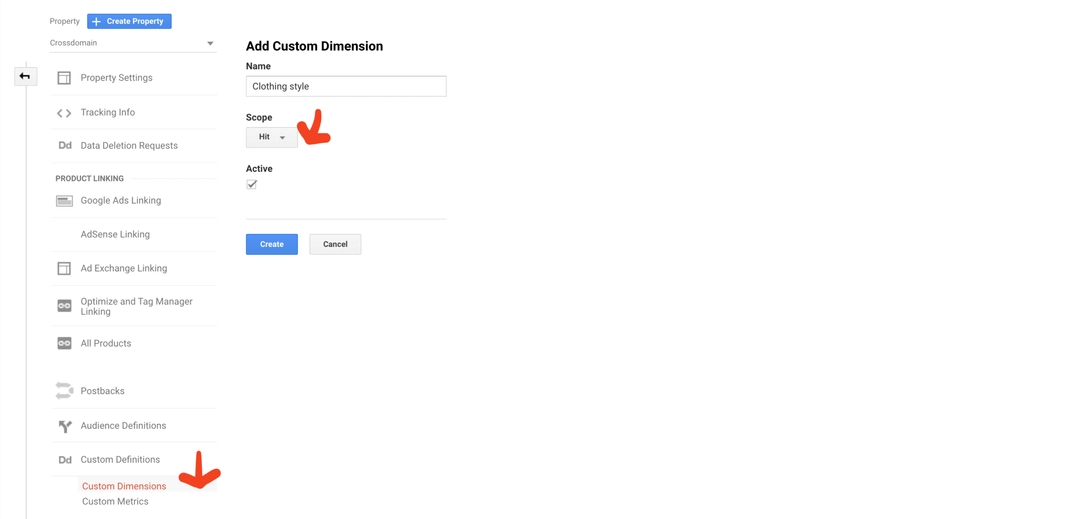
After creating a custom parameter in the Google Analytics interface it will be assigned an index. This index should be used in JS. In the example, we use the index number 1 (for both types):
<script>
window.dataLayer = window.dataLayer || [];
dataLayer.push({
event: 'checkout',
ecommerce: {
checkout: {
actionField: {step: 1,
option: 'DHL'
},
products: [{
name: 'iPhone XS Max',
id: 'A123',
price: 799.00,
brand: 'Apple',
category: 'Smartphones',
variant: 'Gold',
quantity: 1,
dimension1: 'Max' // this is custom dimension value
metric1: 3 // this is custom metric value
}]
}
}
});
</script>
Google Analytics has a limit on the number of user values and metrics. The limit for both types of custom data is the same and equal to 20 for each property in Google Analytics.
How to check if the embedded code is correct? (debug)
We always use the extension for Google Chrome: datalayer.
It is so convenient that in most cases, it allows you to not use the standard debugging mode in Google Tag Manager.
After installing the extension, the Datalayer tab appears in the Google Chrome console.
video
It displays the following information:
Datalayer, which successfully worked on the page. The tab contains the name of the variables and their values. This is incredibly convenient for tracking the correctness of data and searching for user events to activate the tag.
The last column of the tab contains the generated tags and their contents. Within each tag, you can see whether it contains Enhanced E-commerce data, as well as track their values.
If you have errors in the code and the data does not go to Google Analytics, you will immediately see this in the datalayer extension.
If instead of the current value of the parameter, the report field remains empty, then this particular variable does not transmit the value, and the code needs to be fixed.
What problems should be expected after implementation of Enhanced Ecommerce and how Renta solves them?
The introduction of Enhanced E-commerce tools on the site is the first step towards analyzing the effectiveness of advertising channels. However, to understand what marketing tools work for your business, you need to analyze the data collected.
At this point, you may encounter the following problems:
Sampling data in Google Analytics reports
Building an attribution model
Exporting data from advertising systems, CRM systems to your own data warehouse.
All these tasks can be effectively solved using Renta tools. While analyzing each of the problems, we will focus on the reasons and competitive advantages of Renta.
Sampling data in Google Analytics reports
When generating reports in Google Analytics, users are faced with the fact that Google, in order to reduce the load on its servers, often uses data sampling.
In this case, only a small fraction of the real data from your site is included in the sample, which is then extrapolated to 100%.
That is, Google Analytics makes the assumption that arbitrary 10% of the real data from the entire sample is similar to the remaining 90%.
This leads to severe distortion of statistics, and the problem of data sampling must be solved without fail.
There are several solutions.
If you need to get data in the Google Analytics interface, then:
Do not use heavy reports with a large amount of data. Reduce the time of the reporting period or the number of metrics used – this reduces the amount of data, and sampling will not be applied to reports.
Use high accuracy instead of quick report creation:
![]()

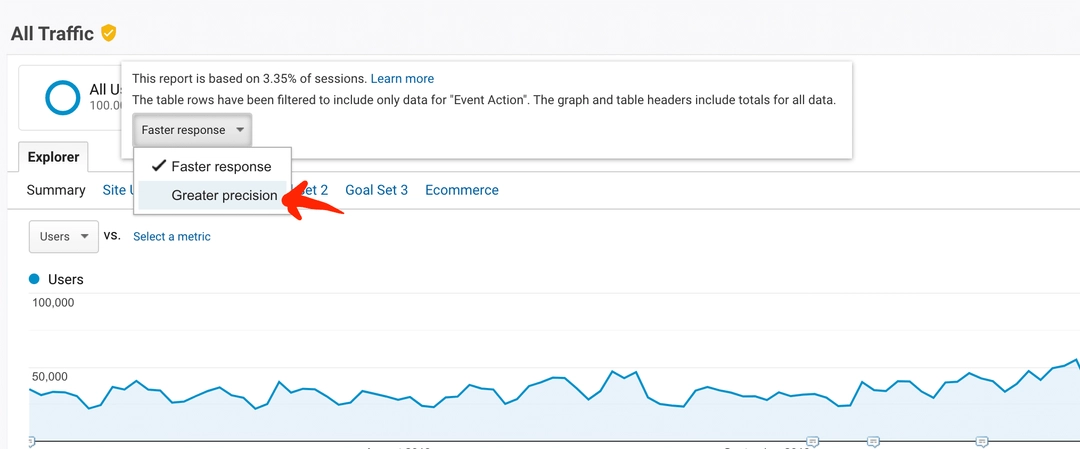
This setting is available at the level of all reports in Google Analytics.
Uploading data from Google Analytics using third-party services:
Google Sheets Add is our favorite Google Sheets add-on that lets you upload data to Google Sheets on a schedule.
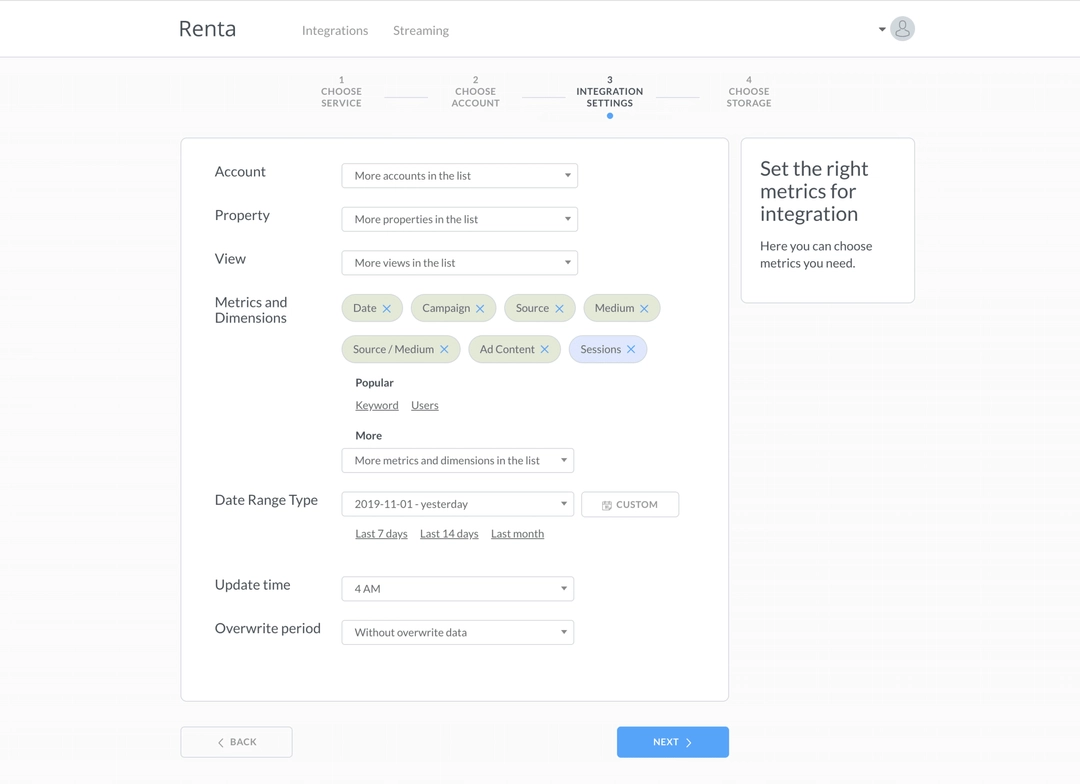
Renta Marketing ETL– contains a solution for uploading scheduled Google Analytics data to various data warehouses (you can choose between Google BigQuery, ClickHouse and SQL Server). Sampling when uploading data from Google Analytics can be avoided by crushing queries. That is, instead of a monthly report, a daily upload is configured. With such a small amount of data, sampling is not included, and the figures exported are reliable. Daily reports from a monthly report are based on real numbers.
![]()
If your project does not have daily sampling, working with Renta Marketing ETL is very convenient.Core Reporting API — use the Google Analytics API to develop your own data upload application in the required data warehouse.

Streaming Google Analytics Raw Data to Google BigQuery:
Google Analytics 360 — the cost is $ 150,000 per year, while the problem of sampling in the Google Analytics interface is not solved, but is closed by exporting raw data to Google BigQuery.
Renta Data Streaming — All real-time data sent by Google Analytics is duplicated to the data warehouse.
The data structure is identical to uploading Google Analytics 360 data to BigQuery. The cost starts from 115$/month.
Building an attribution model
The catchphrase of the legendary American businessman John Vanameyker: “I know that half of my advertising budget is wasted, but I don’t know which one.”
More than a hundred years have passed, and absolutely everything has changed in advertising, but marketing specialists are still faced with the problem of the correct distribution of the advertising budget.
By default, Google Analytics uses the last-click none direct model to track successful transactions. This means that all the value goes to the last (not direct) channel.
Let us take the path of the buyer of an online store as one of the typical scenarios:

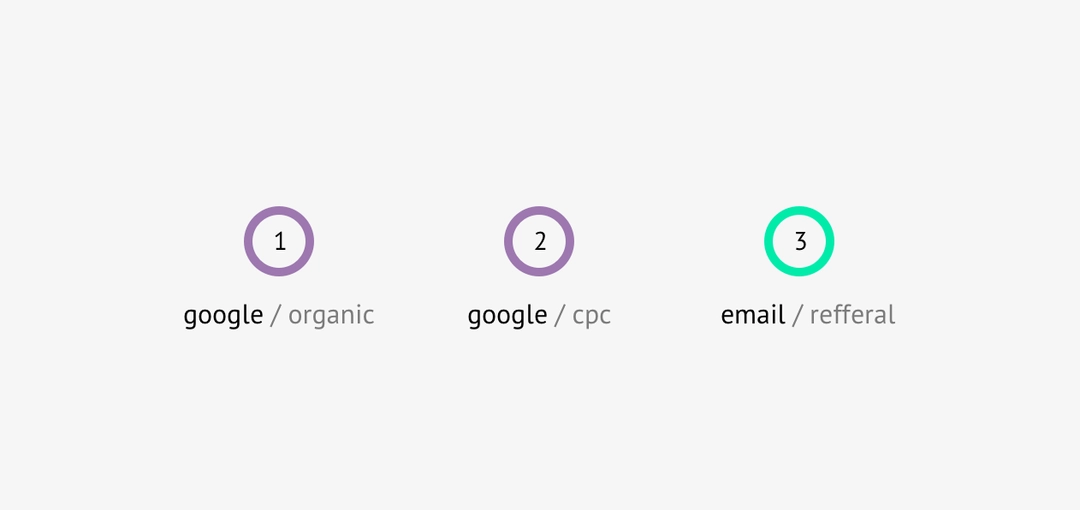
A person switched to a site from a search engine for the first time due to high-quality search engine optimization (SEO).
Then the user returned to the site from retargeting networks, such as video ads on YouTube. This time he leaves his email address in order to receive some bonuses from the store.
Returning via e-mail newsletter, a person makes a purchase.
In Google Analytics, thanks to the last-click none direct model, all the value goes to the last channel, that is, the email newsletter.
We understand that without the previous steps, the user would never leave us his email address that ultimately led to the transaction. However, this long journey is not taken into account in the standard report. Evaluating the effectiveness of advertising channels with the last click is wrong and absolutely does not help the marketer understand just how effective his investment in marketing tools is.
For the correct model of managing advertising channels, it is necessary to use an attribution model that correctly distributes the value of orders across all advertising channels that led to the transaction. Here you need to understand that there is no single correct model – the choice of methodology depends on the business.
Therefore, in our Renta service several of the most popular attribution models on the market are available at once:
Attenuation-based
Markov chains
Sales funnel
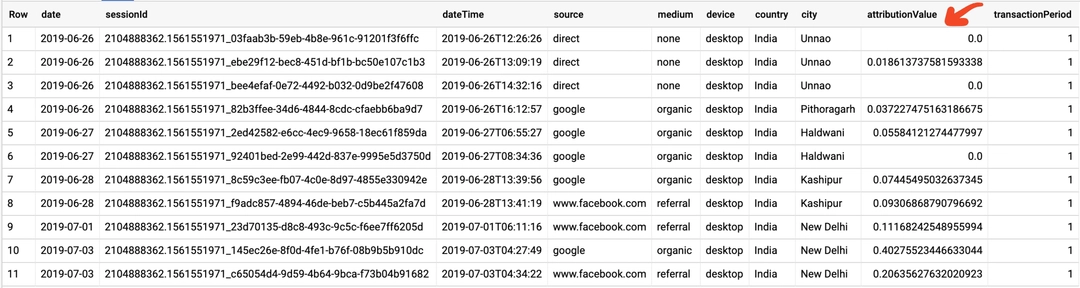
Renta users get the opportunity to compare different attributions, see how revenue is distributed to advertising sources, and choose the most suitable model that matches the logic of your project.
The attribution results are available in Google BigQuery:

We will prepare a comparative analysis of attribution models in the next publication.
Export data from advertising systems, CRM systems to your own data warehouse
Renta also allows you to combine attribution models with offline data. For example, with data from a CRM system. This allows you to calculate attribution based on business metrics. For example, only for completed orders or for a specific segment of customers.
If you have any questions or suggestions – join the discussion in the comments!