A modern data stack is a set of tools you use to gather and process all the data you need to develop your product in 2026.
What does a modern data analytics stack look like?
Simply put, it's an integrated modular system of technologies for analyzing your business performance. The layers of the stack consist of many tools each of which performs one simple action, such as storing data, merging and transforming data, and visualizing it. This way, the system is highly customizable and adjustable.


For instance, you can change your data pipeline tool to a more efficient one without having to readjust all of the other layers. Essentially, the modern data analytics system should consist of three steps:
Collecting, consolidating, and storing data. To be able to organize and later analyze the data, first, you need to gather all the raw data you can get and use it in one place – in a data warehouse.
Data transformation. Raw data often contains excrescent information that can't be meaningful or useful for marketing or product teams. All the gathered data should be cleaned, transformed, and shaped so that it can be used later.
Reporting/Analysis. The data is more useful for the business when it's presented well and understood by all the team members.
Let's take a closer look at each step to better understand the modern analytics system.
Table of contents
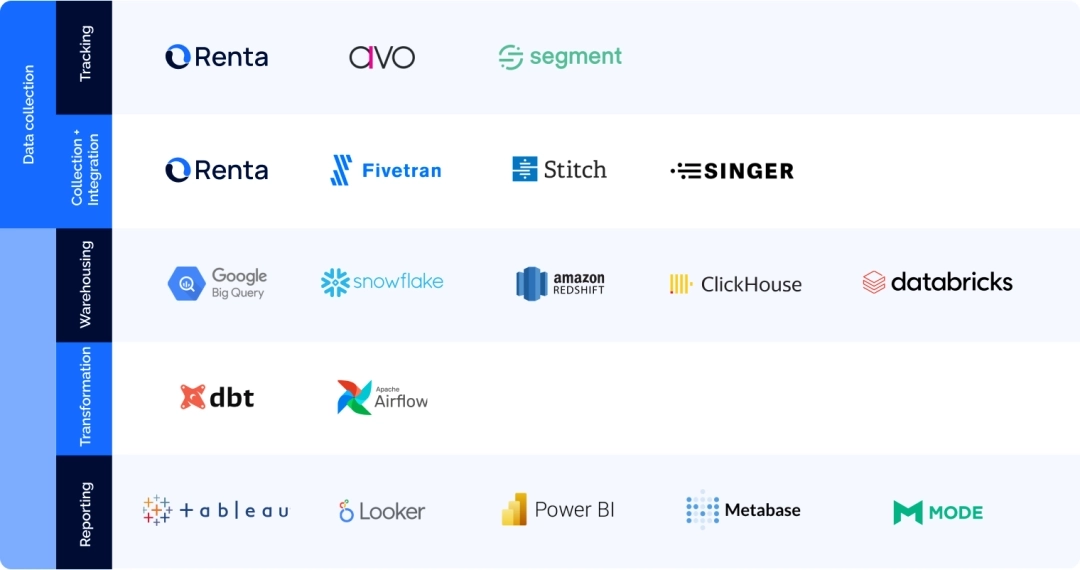
Data collection
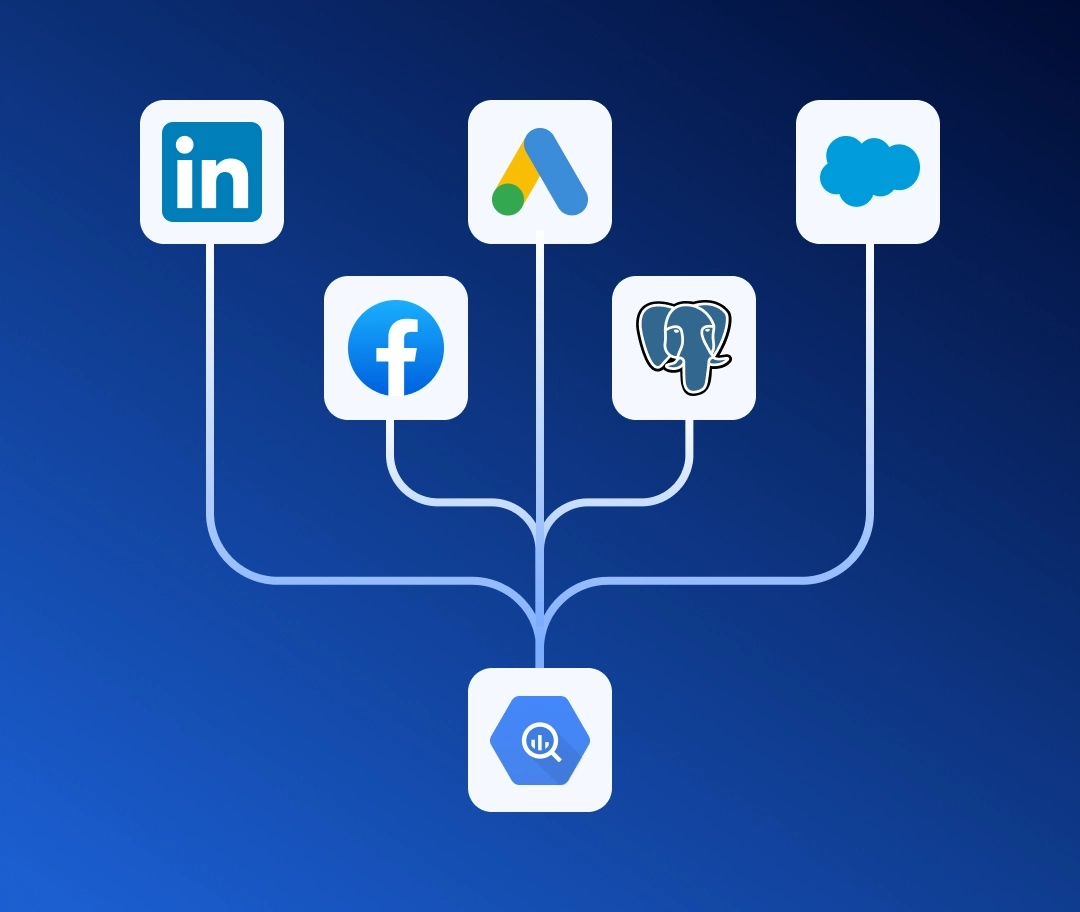
Most likely, your company collects information from multiple data sources, for instance, your Google Analytics, your ad performance metrics and expenses, your marketing tools, and your CRM apps. To see the bigger picture, you need to centralize all that data in a data warehouse.
The warehouse is the central body of your analytics stack. You pull your raw data from all the sources into it to later transform the information and use it in reports.


The data collection step in product and marketing analytics consists of three important components:
- Data warehouse
- User behavior streams
- ETL pipelines
Data warehouse
There are multiple cloud storage solutions to choose from. For instance, Snowflake or Google BigQuery. When picking a data warehouse, you should carefully analyze how you use and process the data, because each solution has its own features and pricing nuances.
BigQuery, for instance, adjusts the price automatically based on your data consumption. This means that you don't have to really worry if you're hitting any limits of your plan – the platform will charge you in accordance with your consumption.
Snowflake, on the other hand, gives you more control over your data warehouse architecture. This allows for a more transparent and predictive pricing system, but also results in some restrictions in data storage and query performance.
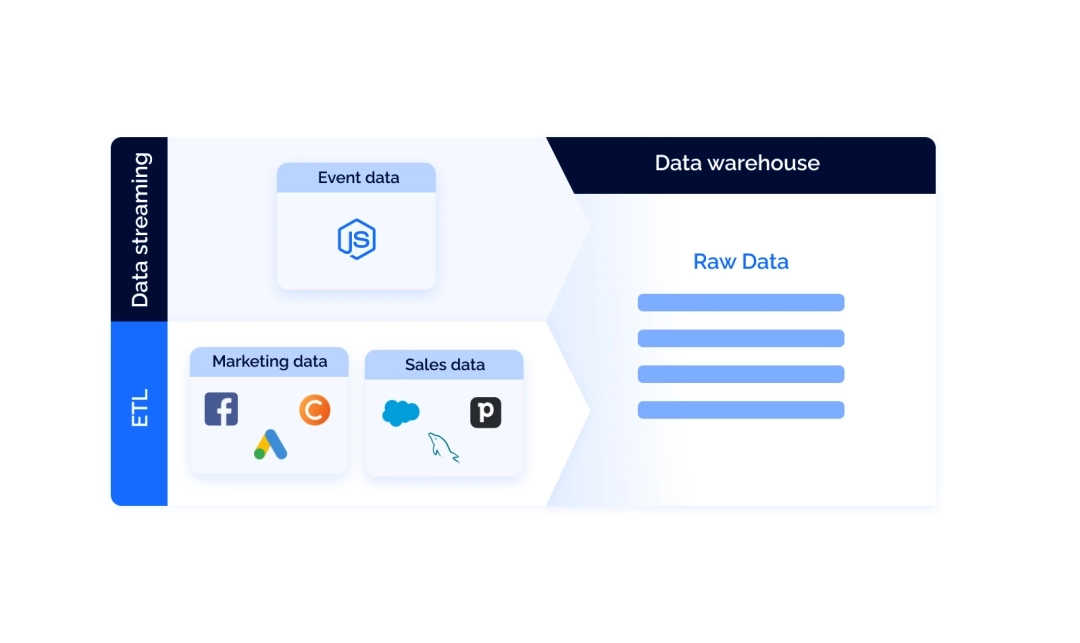
The next step after setting up the storage is building data pipelines. A data pipeline is essentially a process of moving data from one place (the source) to the other (in our case, a warehouse). Typically, there are two types of data that need dedicated pipelines: user behavior data and third-party data.
Real-time streaming of user behavior data
Real-time streams collect user behavior data from your app or website. Tools like Renta Javascript SDK track all the user activity on your website or app and send it to your warehouse. The important thing here is that tools like this support server-side integration and provide data collection as first-party data, bypassing third-party cookie restrictions. This allows for a higher quality of data.
Real-time data streaming tools are good alternatives to Google Analytics 360. They still ensure that you don't violate the GDPR regulations and that the quality of your data is not compromised by intelligence tracking preventions while being much more affordable.
ETL/ELT pipelines
These pipelines transfer third-party data from external services you use in your work. Third-party data could be, for example, the detail on your deals from Salesforce or marketing costs from Facebook Ads. To build a pipeline for this kind of data, it's best to use ETL tools.
ETL stands for Extract, transform, and load. As the name implies, ETL connectors work in three steps: gather the data from different API sources, then process it, and, finally, send it to the warehouse.
The great thing about ETL tools is that they create a fully automated process of data collection, and you don't need to put a lot of effort into it.
For instance, Renta's Marketing ETL will allow you to set up the process for all your sources in 4 simple steps. Once you set up flows for both internal and external data for your business, you'll have in your warehouse all the information you need for a 360º view of consumers.
Data transformation
Raw data most frequently comes in a form that's not suitable for business reporting, that's why this step is necessary. The initial transformation is executed while gathering the data (remember what the T in ETL stands for?). However, that's not enough for proper presentation or analysis.
The further processing of that data includes categorizing, unifying, standardizing, adjusting to the business's needs, merging, and more. Essentially, the transformation of data leads to creating data marts, subject-oriented clusters of data.

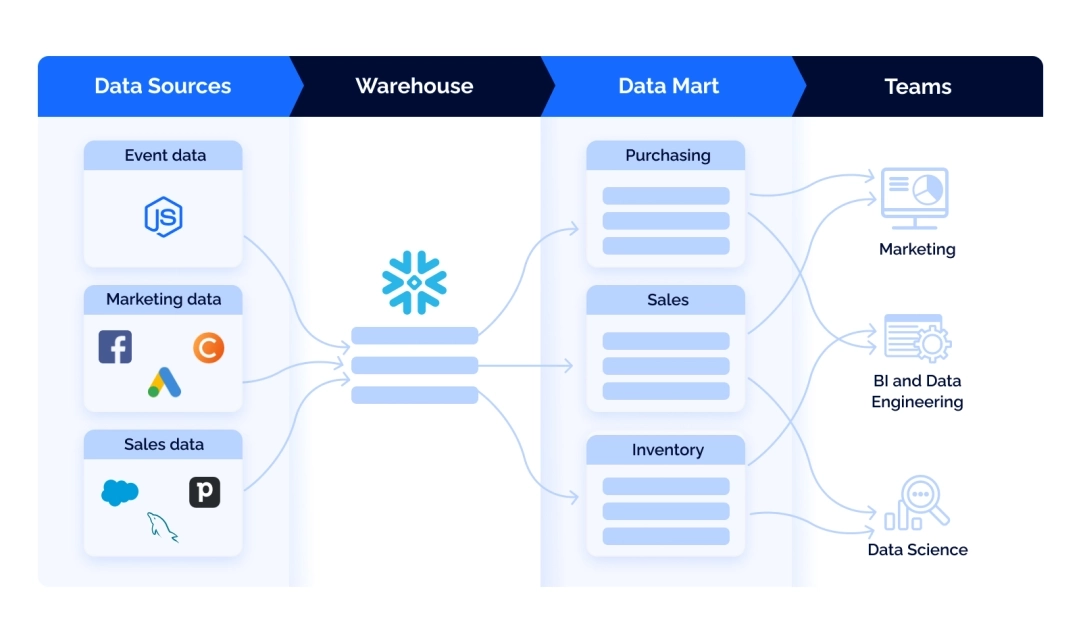
Data marts partition all the information in your warehouse into smaller units dedicated to specific business divisions – for example, sales, marketing, or finance.
For now, the most efficient tool for transforming data, as well as building and managing data marts is dbt.
dbt (data build tool) is an open-source framework that allows analysts and engineers to transform data in their warehouses. All dbt does is compiles all the data to SQL queries and then runs it against your database. This sounds simple, but it does change the game.


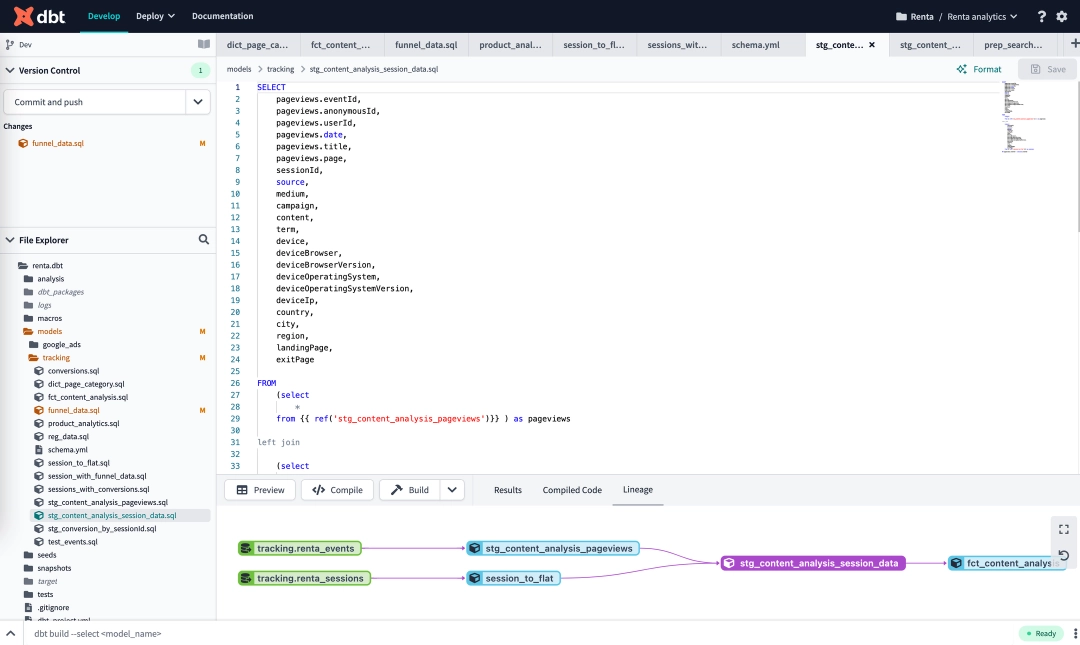
While ETL pipelines perform the initial transformation of data, dbt processes data that's already in the warehouse and creates data marts.
dbt helps to distribute SQL queries in your project's folder so that it's easy to find and execute by any member of the team.
With dbt, you can apply programming logic to analytics. It allows building reusable and modular code using Jinja to create models that can be referenced later instead of manually writing SQL queries every time. It allows compiling the queries depending on the data warehouse you're using – if you change your storage solution, you won't have to rewrite the queries.
Moreover, dbt allows data documentation, bug tracking, GitHub sync, testing, and more.
Reporting
The final step of data processing is visualizing it in comprehensive charts and reports. This is the part where you use different visualization tools, like Looker or Power BI, for ad-hoc reporting, regular reporting, and data exploration.

Using business intelligence systems, you can compile reports using data from different sources, set key metrics, and create visualizations – all that is automated and updated regularly. BI systems are connected to your data warehouse and prepare reports without any effort from your side.
In conclusion
Data is the driver for any modern business. It can give you insights into how your customers interact with your products and how you can make that interaction better for the final user and more profitable for you. To be able to find these insights, you need to set up a strong analytics stack that will gather and process all the information for you.
A modern analytics stack should reflect a simple three-step process: collecting-processing-executing. All these steps can be automated and optimized – and once all that is set, you can proceed to interpreting and using that data to grow your business.