Today we are pleased to introduce you to a new data source: Javascript SDK.
Javascript SDK is a first-party tracker for product and marketing analytics. The source supports server-side implementation, which ensures high-quality data collection that meets the requirements of Schrems II and GDPR.
The cherry on top is the ability to integrate data in real-time not only with the Data Warehouse, but also with third-party applications such as Facebook Conversion API or Webhooks.
And all this in a matter of minutes.
Reasons for switching to first-party tracking
Our team set itself the solution of the following tasks when designing the Javascript SDK:
Data Quality
Radical restriction and complete disabling of third-party cookies in the future may be critical for the operation of analytics products.
User tracking prevention systems such as Intelligence Tracking Prevention (ITP) in Safari and adblocking extensions (such as AdBlock) already restrict or completely block the operation of third-party cookies. Google Chrome has announced the refusal of third-party cookies by the end of 2023.
These restrictions do not have any effect on the Renta Javascript SDK, which significantly improves the quality of data.
Data Activation
To provide businesses with high-quality data for use in various teams, and not only for marketing and product analytics.
Ready-made server-side integrations allow companies to meet the need for fast data integration with various teams and products in a matter of minutes.
This is a fairly wide spectrum of tasks: ranging from the integration of user behavioral data into a CRM system to reliable data flows for a recommendation system.
Data Privacy
The Javascript SDK provides secure first-party data collection in the required jurisdiction, and server-side data tagging allows you to transfer tracking tags from the site (both marketing and analytical) to the server-side.
It means that there is no direct connection between the user and the advertising vendor, and you have full control over what data is transmitted to a third party and in what form.
Implementing the Javascript SDK
This step-by-step guide will help you set up first-party data collection for product and marketing analytics. The data becomes available for streaming to your data warehouse and synchronization with third-party business tools such as Facebook Conversion API, Salesforce or Zapier.
Go to the integration catalog and select the Javascript SDK. Then specify the configuration of the data source including your site URL.


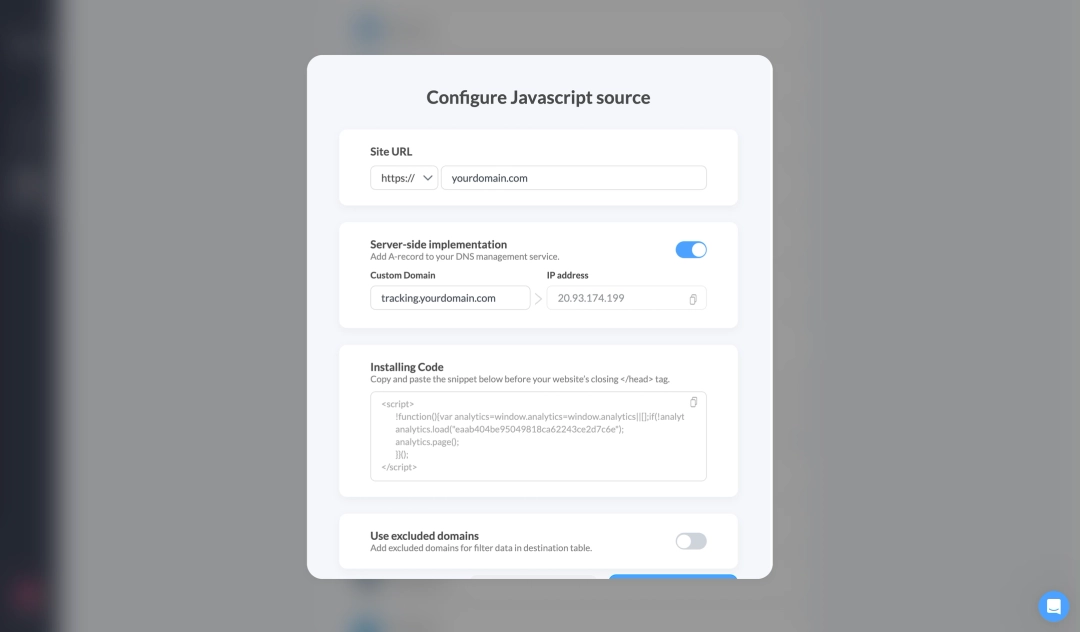
This setting provides tracking on behalf of your personal domain. We strongly recommend using your own subdomain to improve data collection quality, since ad blockers and intelligent tracking protection (ITP) don't affect the Renta Javascript SDK with this enabled setting.
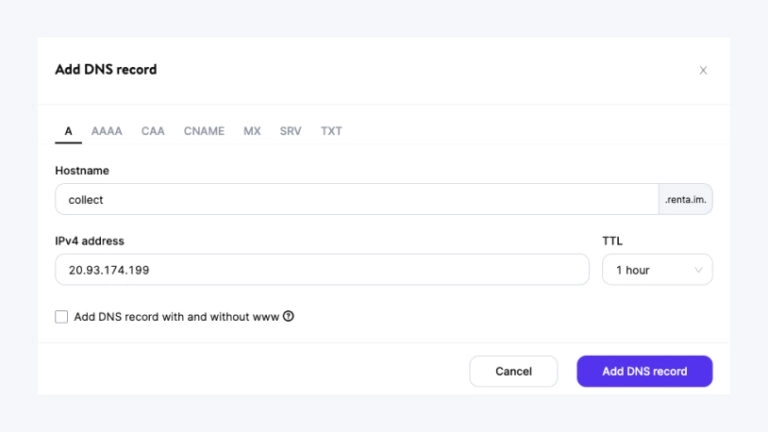
Create a subdomain (e.g., collect.yourdomain.com) in your DNS settings and specify the provided IP address as an A-record. Your IT department can use the standard technical specification for custom domain implementation.


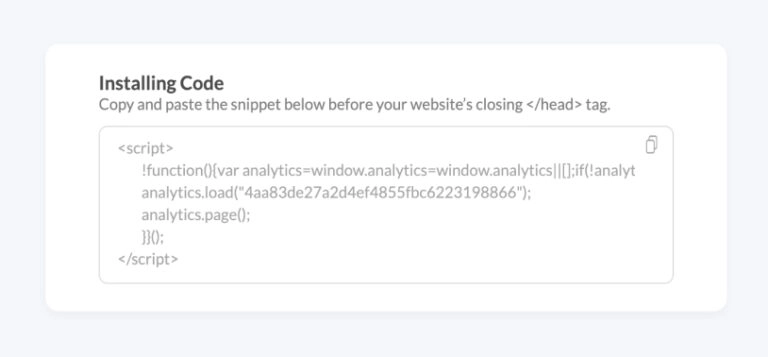
Copy the received tracking code and install it on all pages of your site. This code tracks all pageviews by default, but you can also configure custom events tracking.
Renta will automatically create a secure architecture for server-side tracking and ensure smooth operation of the server environment. You don't need to deploy servers yourself, unlike tools such as Google Tag Manager Server-side.


Data structure
In developing the Javascript SDK, we decided to pull the variances between the product and marketing analytics teams – those teams often use different tools:
Product analytics tools help you make decisions to improve the product by measuring and analyzing user behavior in the product. These analytics systems work on the basis of events, where each event captures a specific action in the product.
Marketing analytics is used to analyze and optimize advertising campaigns. Analytics is based on sessions, where each session is assigned to an advertising channel.
This leads to the fact that several analytics systems are being implemented, which can provoke problems in the data:
The implementation of event/conversion tracking by different teams leads to different logic for event data fixing, mismatch of field names, or their complete absence.
In addition, analytics systems aggregate the data in different ways, which also leads to disagreements.
At the same time, marketers need user action data on the product, and product analysts need marketing data to build segments.
We have taken care of the Javascript SDK data is well structured, both for product and marketing analytics. As a result, the SDK collects three layers of data:
- Event-level data
- Session-level data
- User-level data (soon)
A separate table is created in the data warehouse for each data level.
Event-level data
The Javascript SDK is built on four types of events:
| Event type | Description |
|---|---|
| page | Captures information about page views. |
| track | Provides tasks for tracking user actions. For instance to track transactions or subscribe to a newsletter. |
| identity | Recommended to use only to collect users' personal data. Helps to build a user profile. |
| group | The event is used to track a group of users. |
The advantage is the ability to completely customize each event due to custom fields (we call them properties). That is, you can specify a unique set of properties for each event.
In addition, each event comes with standard fields, such as personal data, device characteristics, or UTM parameters. You can get acquainted with the full list of standard fields in the documentation.
So you get:
- A flexible event creation system that completely covers the tasks of product analytics
- Real-time data collection into personal data warehouses such as Google BigQuery or Snowflake
- Full compatibility with marketing analytics data (a session table is built on the basis of events)
Session-level data
The session table is aggregated event data for marketing analytics tasks. We use Google Analytics logic in the sessions count and chose it for the following reasons:
- This is the market standard, and users understand the logic of session formation. The difference between the number of sessions of Google Analytics and Javascript SDK is usually no more than 5%
- The Javascript SDK converts the dataLayer data of the Enhanced Ecommerce Google Analytics module into events by default
- You can use existing SQL queries if you have previously worked with Google Analytics raw data
- The familiar data schema. This will ensure a comfortable migration to Renta products
You can learn more about the data schema of the table, the features of the logic of calculating sessions, and possible modifications of counting in the documentation.
About competitors
It may seem to you that we have entered the field of Google Analytics and Mixpanel. In fact, it's true, but the Javascript SDK is a solution for data-driven teams with high data requirements that the classic Customer Analytics platform cannot provide.
We have prepared a comparison table so you can determine at what stage your team is at and which solution will be the best for you at the moment:
| You need Renta Javascript SDK | You need other product and marketing analytics software |
|---|---|
| You need raw data in your data warehouse. | The aggregated data in the analytics system is enough. |
| You need the ability to combine data from different sources, such as Salesforce, or a product database. | The standard parameters of the analytics system are sufficient. |
| You use BI products for reporting and decision-making. | Standard reports are enough. |
| The importance of real-time data. | A delay in receiving data is acceptable. |
| You use the data to activate users. | You use the data only for reporting. |
| Data control and GDPR compliance are important. | It is acceptable to store data on the analytics vendor servers. |
Therefore, the Javascript SDK, along with Marketing ETL, is part of the data collection infrastructure that we are creating as part of a modern analytical stack.
But in fact, there are many potential use cases for this infrastructure that go far beyond what is usually called product or marketing analytics, and one of them is the automation of customer data.
Data Activation
When you have built reliable data pipelines for analytics, you will undoubtedly come to transfer the collected data back to the CRM, Conversion API, or marketing automation platform and launch further events on top of the collected data.
This is a huge area of opportunities that server-side technologies open up to us.
The Javascript SDK allows you to set not only the data warehouse as a destination but also integrate with other systems using the API. Today we are ready to present two destinations with third-party tools: Facebook Conversion API and Webhook destinations.
The following data is available for real-time synchronization:
- Event-level data: standard and custom event fields
- User-level data
How does it work?
Select the project created by the Javascript SDK and specify the final destination. For example, Facebook Conversion API.
Then you will find yourself on the configuration settings page, where the main goal is to specify the mapping fields for synchronizing the data collected by cookieless tracking with the destination point.
This provides full control over the data you share with a third party.
Filters in the activation trigger allow you to create any segment of users who have performed a specified action. This allows you to adapt, among other things, to the legal standards of data collection in your company.
Eventually:
- You get a ready-made solution for customer activation in a matter of minutes
- Renta automatically converts Javascript SDK output data into a destination data format and hashes them
Quick start
Use this guide to create a reliable first-party data pipeline. And do not hesitate to contact the customer success team if you need technical assistance.