Manually gathering data from ad accounts eats up valuable time and increases the risk of errors. If you work with LinkedIn Ads, you know that exporting reports for analysis is a tedious task you'd love to automate.
In this guide, I will show you how to set up a robust data pipeline from LinkedIn Ads to Google BigQuery, allowing you to eliminate manual data collection and focus on analyzing your ad campaigns.
It all started with a simple and clear request we received from Stanislav Gorlenko, Head of Digital at Ajax Systems:
Hi! I actually have a very simple task — just to create a pipeline to transfer data from LinkedIn to BigQuery. The only problem I see is that you can't transfer the campaign name, and that's critically important.
This task isn't unique. The absence of campaign names in the main statistics report is a key obstacle for many marketers. Our team solved this problem by creating pre-built templates that automatically generate the necessary tables in Google BigQuery and keep them up-to-date.
Before we dive into the setup, let's understand how the LinkedIn Ads API works and what its main complexity is.
What makes the LinkedIn Ads API complex?
To get a complete picture of ad performance, we need to gather data from three different sources (API endpoints):
| Report name | Description |
|---|---|
| Ad statistics report | The main statistics report. This contains key metrics like impressions, clicks, spend, and conversions. |
| Campaign metadata report | Campaign metadata. This stores campaign names, statuses, cost types, etc. |
| Ad metadata report | Ad creative metadata. This includes the names and details of specific creatives. |
The main catch is that the most important endpoint, Ad statistics, doesn't return campaign or ad names.
It only provides metrics tied to an ad identifier (creative_id).
To answer a simple question like «How much did we spend on campaign X?», data from a single data source is insufficient. We first need to get the statistics and then enrich them with data from the other two endpoints, where campaign names, creative names, and other important attributes are stored.
How do we build a data mart?
To build a data model, we create three tables in Google BigQuery, corresponding to the LinkedIn endpoints, and then combine them using a simple SQL query (an example of which will be provided further below).
The merge schema looks like this:


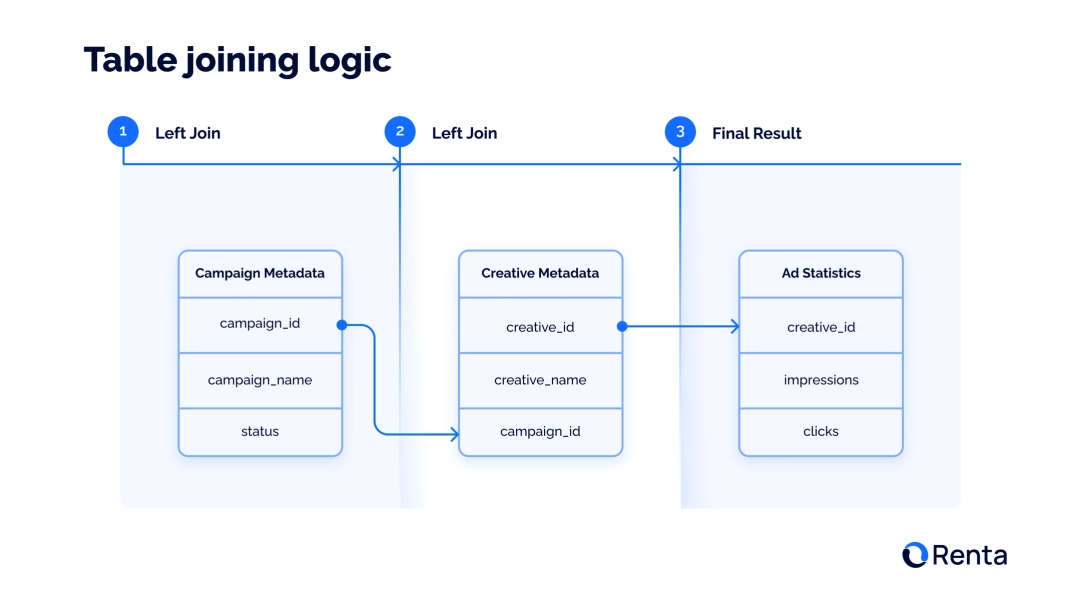
You can also review the LinkedIn Ads ERD (Entity-Relationship Diagram), which outlines all available objects for export in Renta ELT, along with the keys and relationships between tables. Let's break down exactly how this relationship works, using the example of the SQL query that forms the basis of our data model.
Step 1: Start with statistics
At the core of everything is the ad_statistics table. It contains daily metrics on ad campaign performance: impressions, clicks and spend. But instead of names, it only has an creative_id.
Step 2: Add Ad metadata
To find out what's behind the creative_id, we LEFT JOIN the ad_creative_metadata table. The linkage happens using the creative_id key. Now, each row of statistics has the creative_name and, most importantly, the ID of the campaign it belongs to campaign_id.
Step 3: Add Campaign metadata
With the campaign_id, we take the final step. With a second LEFT JOIN, we connect the campaign_metadata table. By joining them via campaign_id, we finally get all the necessary campaign information, such as its campaign_name, campaign_status, cost_type and other metadata.
Example SQL Query
Here's an example of the SQL query that brings these tables together, forming the basis of our data model:
SELECT
    stats.date,
    stats.creative_id,
    creative.creative_name,
    creative.campaign_id,
    campaign.campaign_name,
    campaign.cost_type,
    campaign.unit_cost_currency_code,
    campaign.account_id,
    campaign.status AS campaign_status,
    stats.impressions,
    stats.clicks,
    stats.cost_in_usd,
    stats.registrations
FROM
    `bigquery-project.Renta_dataset.ad_statistics` AS stats

-- Ad creative metadata
LEFT JOIN
    `bigquery-project.Renta_dataset.ad_creative_metadata` AS creative
        ON stats.creative_id = creative.creative_id

-- Campaign-level metadata
LEFT JOIN
    `bigquery-project.Renta_dataset.campaign_metadata` AS campaign
        ON creative.campaign_id = campaign.campaign_id
As a result, we built a ready-to-use LinkedIn Ads data mart. This is precisely the logic our templates automate.
Setting up the data pipeline in Renta Marketing ELT
Theory is important, but in practice, it's much simpler. We've shown why it's necessary to combine data from different endpoints. Now, let's see how to implement this in a few clicks using Renta ELT, turning a complex task into a reliable data process.
Adding LinkedIn Ads source
Let's look at how to add your LinkedIn Ads account to Renta ELT so you can export data from it to your Google BigQuery project.
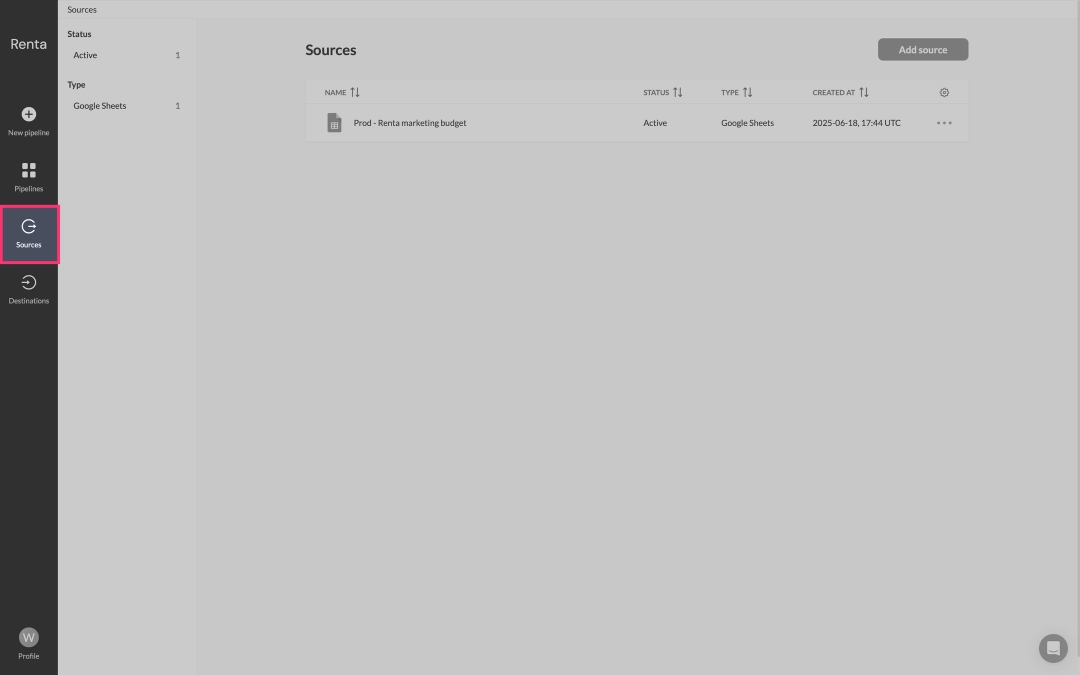
Go to the Sources tab within your Renta ELT control panel.


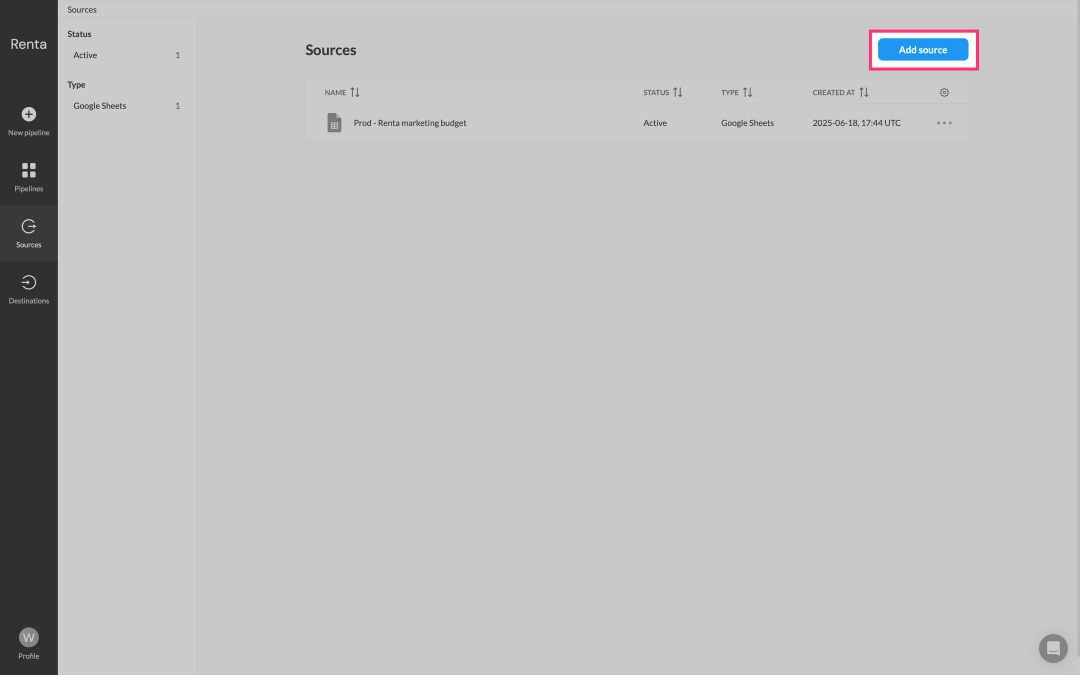
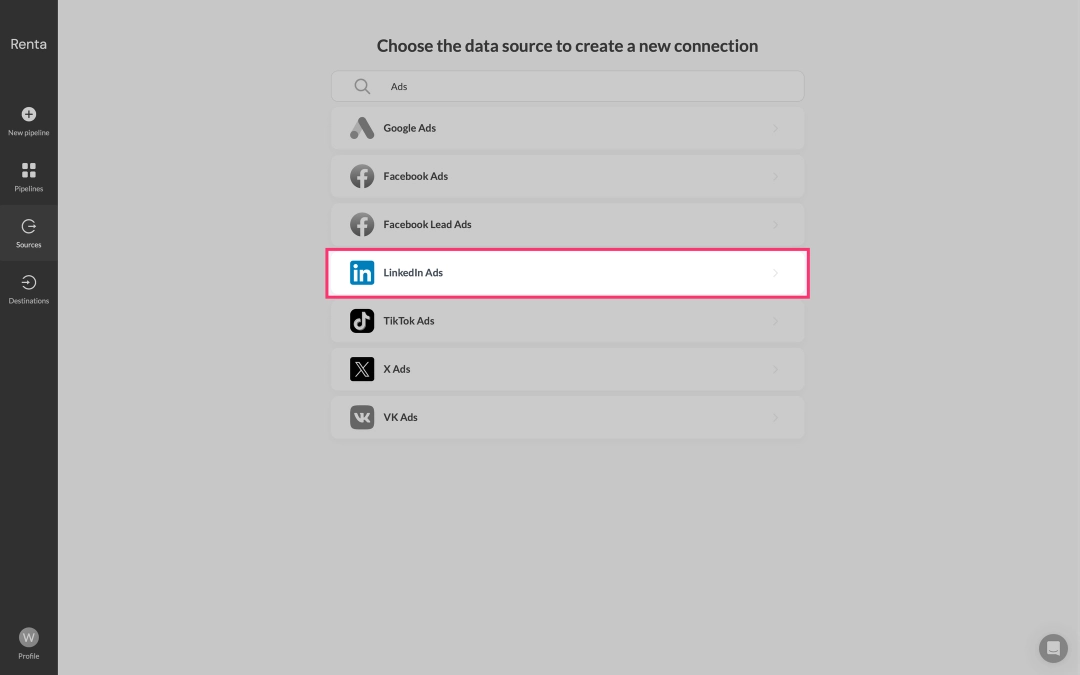
Click the Add Source button to open the catalog of available data integrations.

From the list of integrations that appears, locate and select LinkedIn Ads.

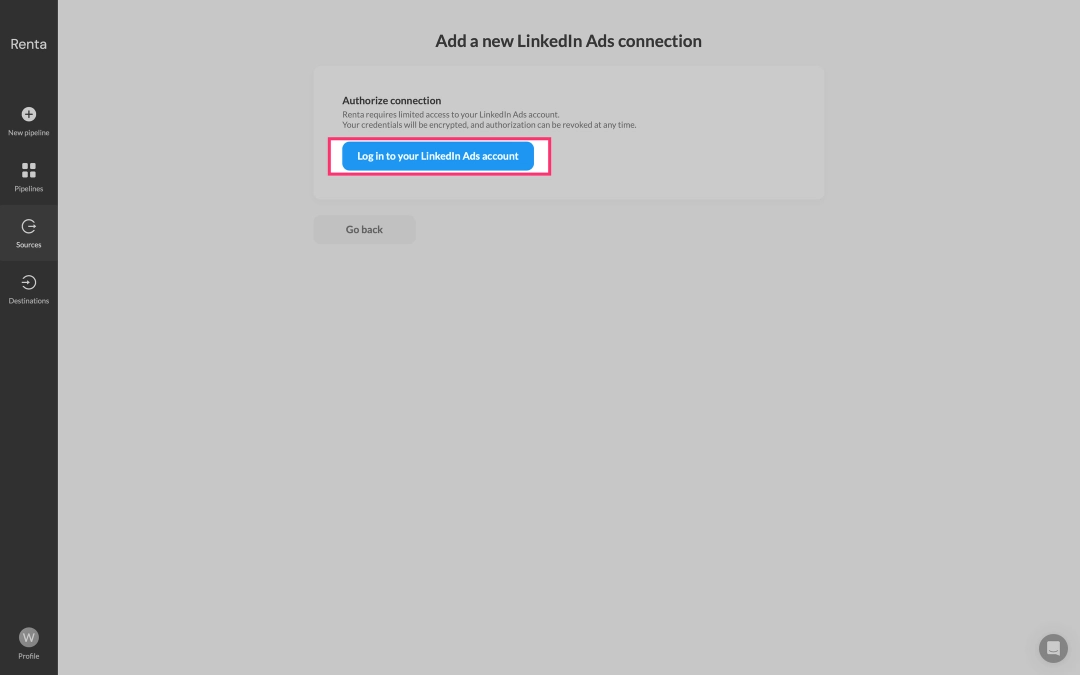
Click the Login to your LinkedIn Ads account button. You'll then be prompted to authorize, granting Renta ELT the necessary access to your ad account data.

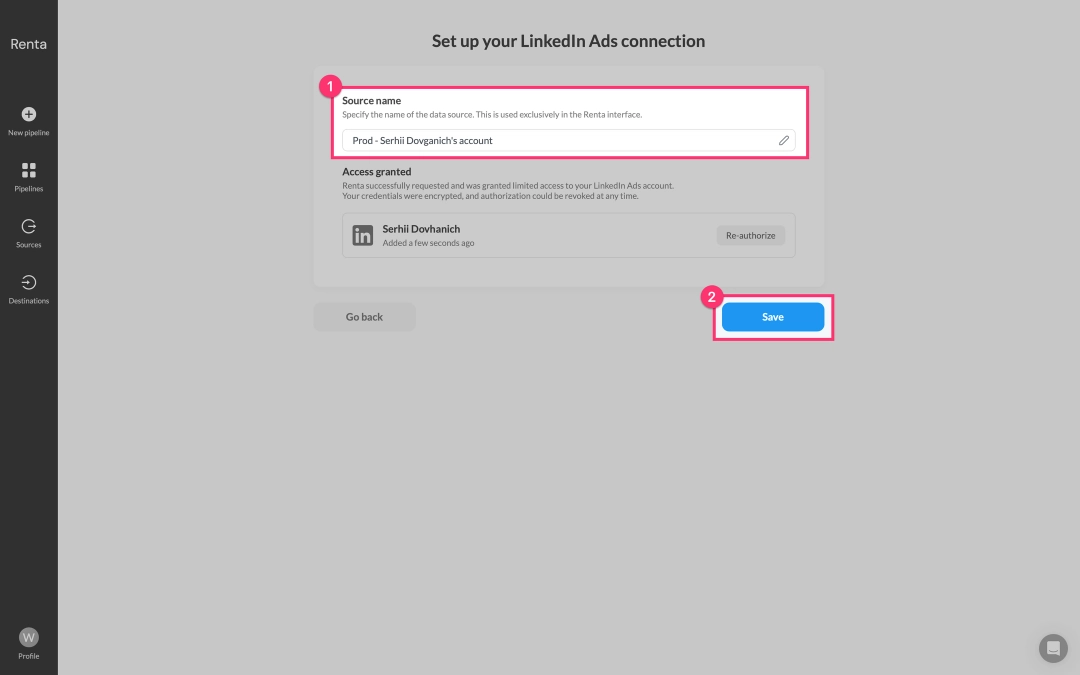
After successful authorization, you'll be redirected to the setup page. Give your new source a clear, descriptive name, for example Prod - Serhii Dovganich's account and then save it.

With your LinkedIn account successfully connected, it's now available as a data source. Our next step is to add Google BigQuery as the destination, which will allow us to configure your data pipeline. Let's proceed to add it.
Adding Google BigQuery destination
Renta offers two types of authorization: service accounts and Google Sign-in. While we'll demonstrate adding your Google BigQuery project using the simpler Google Sign-in method, our recommendation is to use a service account for enhanced security and control.
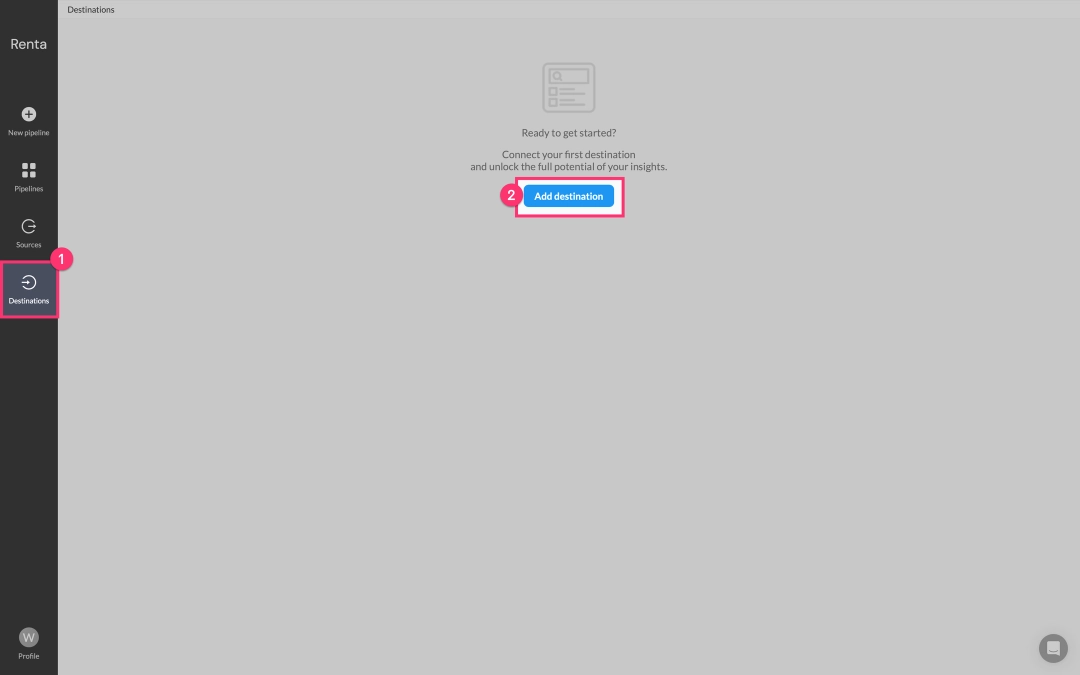
Navigate to the Destinations tab and click Add destination.

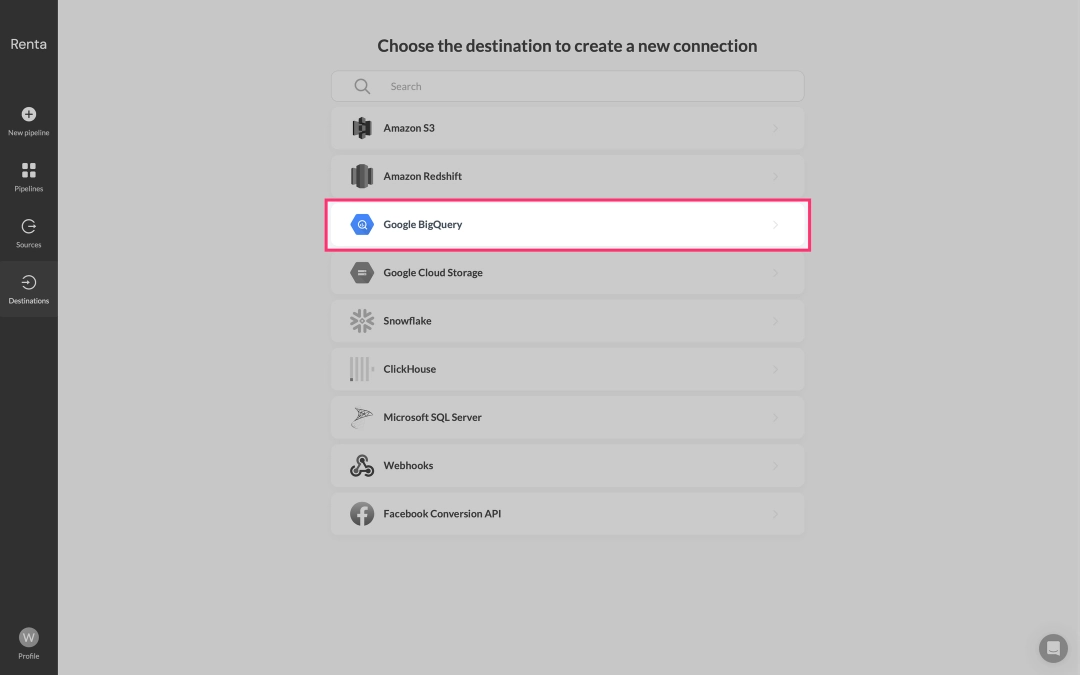
From the integrations catalog, choose Google BigQuery.

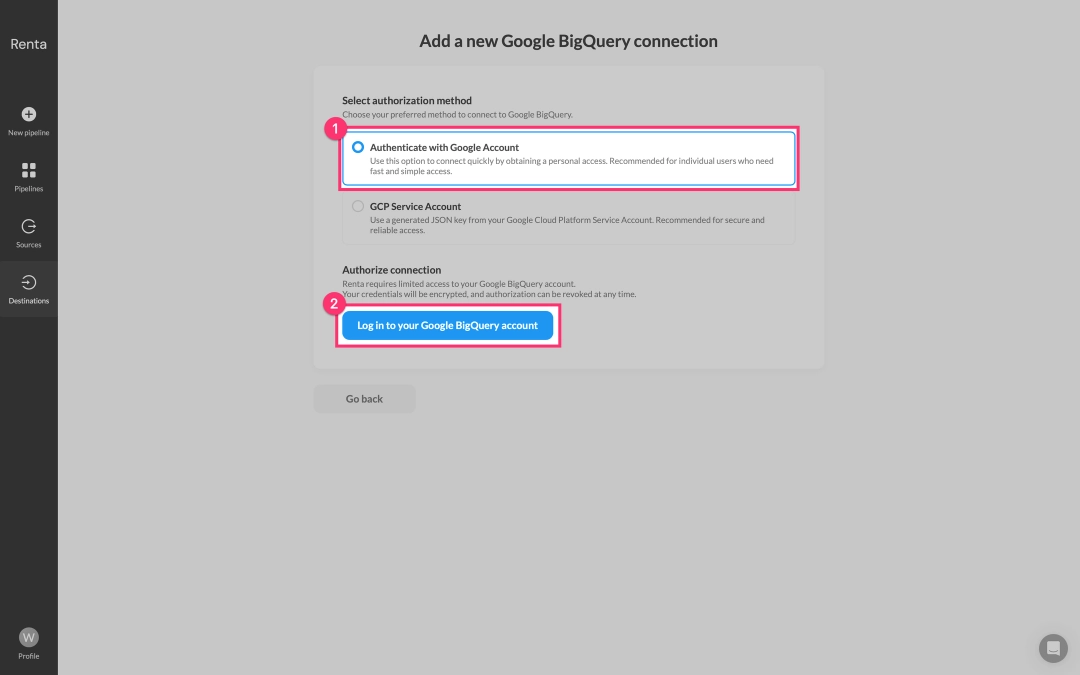
The system will prompt you to connect your Google account. We are using Google Sign-in as it's the simplest and fastest method. Alternatively, a Service account can be used for more complex security setups. Click the Login to your Google BigQuery account button.

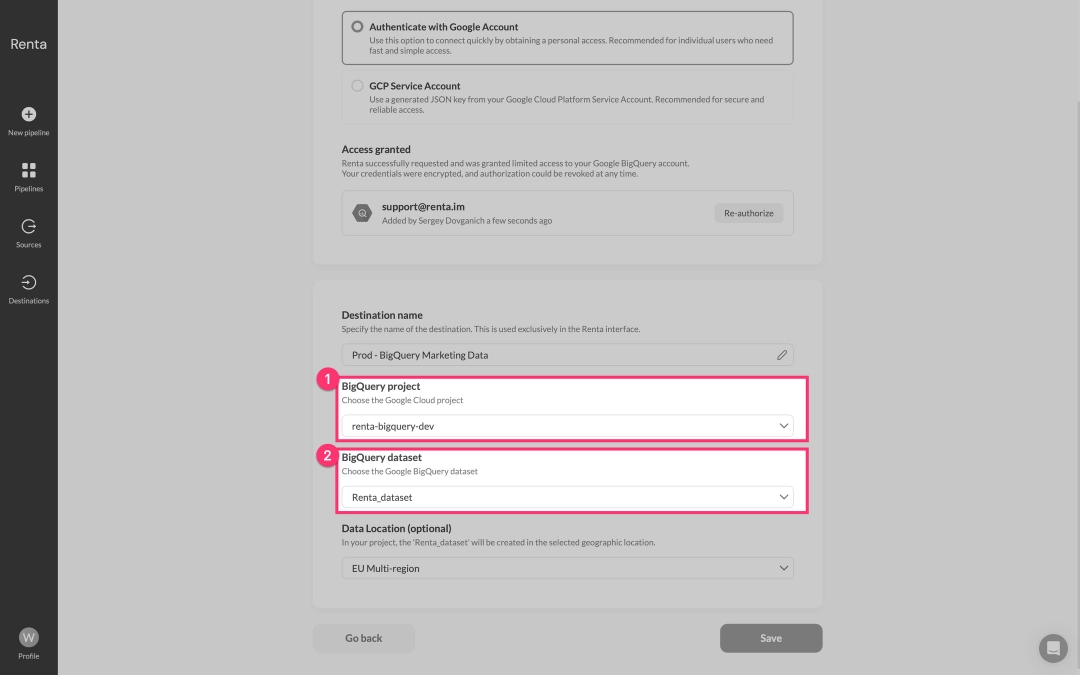
After successful authorization, specify the Project ID and the Dataset ID where your data will be loaded within BigQuery.

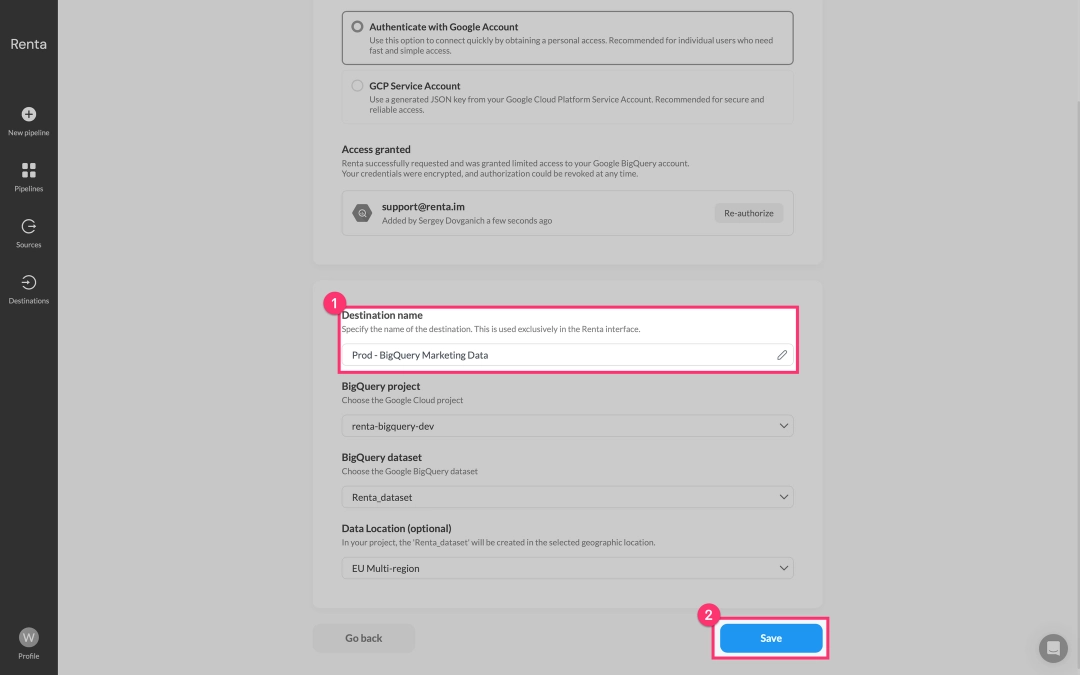
Give your destination a descriptive name, for example Prod - BigQuery Marketing Data and save it.

Now that you've added your source and destination, we can proceed to configure your data pipeline.
Creating the data pipeline
This is the final and most important stage, where we configure the data pipelines. We'll use pre-built data model templates, which simplify the creation of data flows.
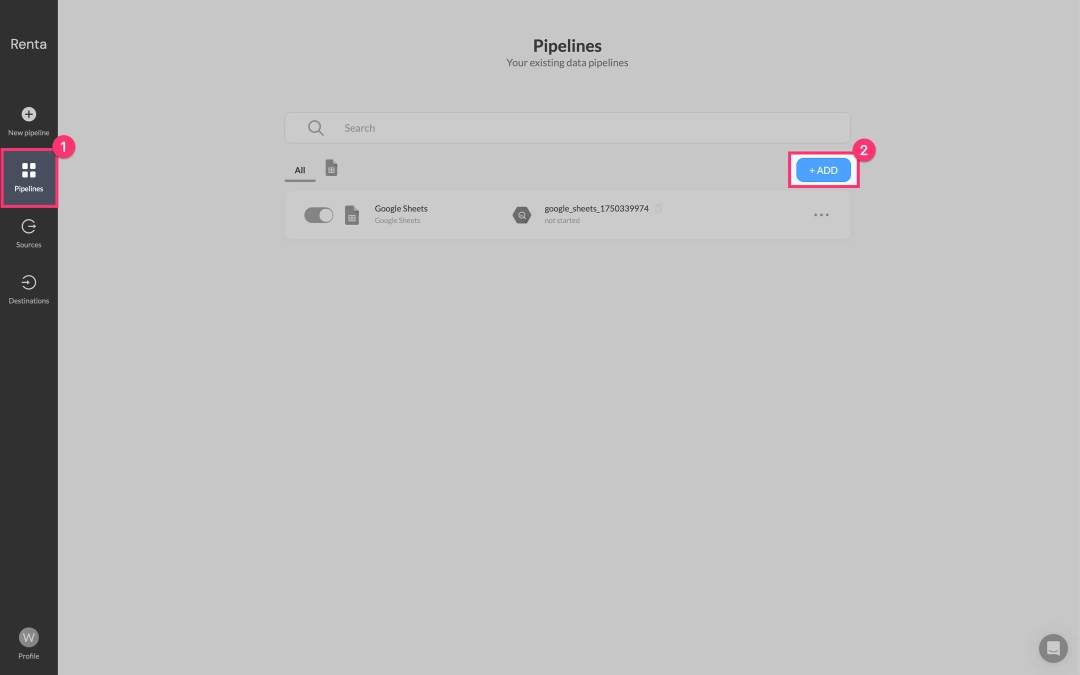
Navigate to the Pipelines tab and click Add Pipeline.

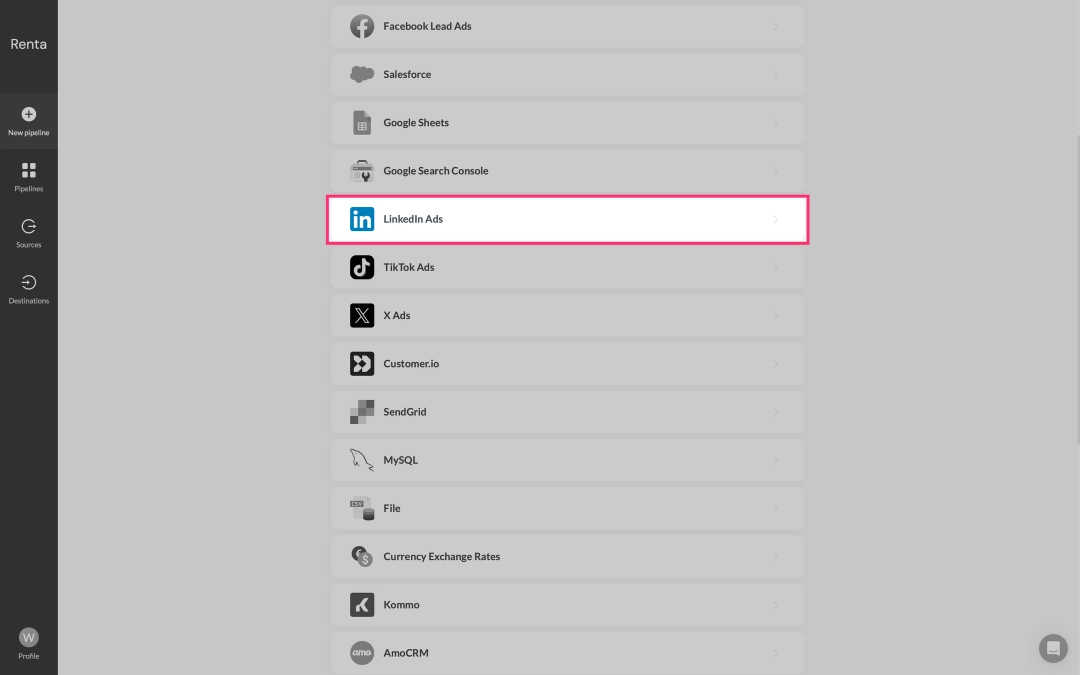
First, in the data sources catalog, select LinkedIn Ads.

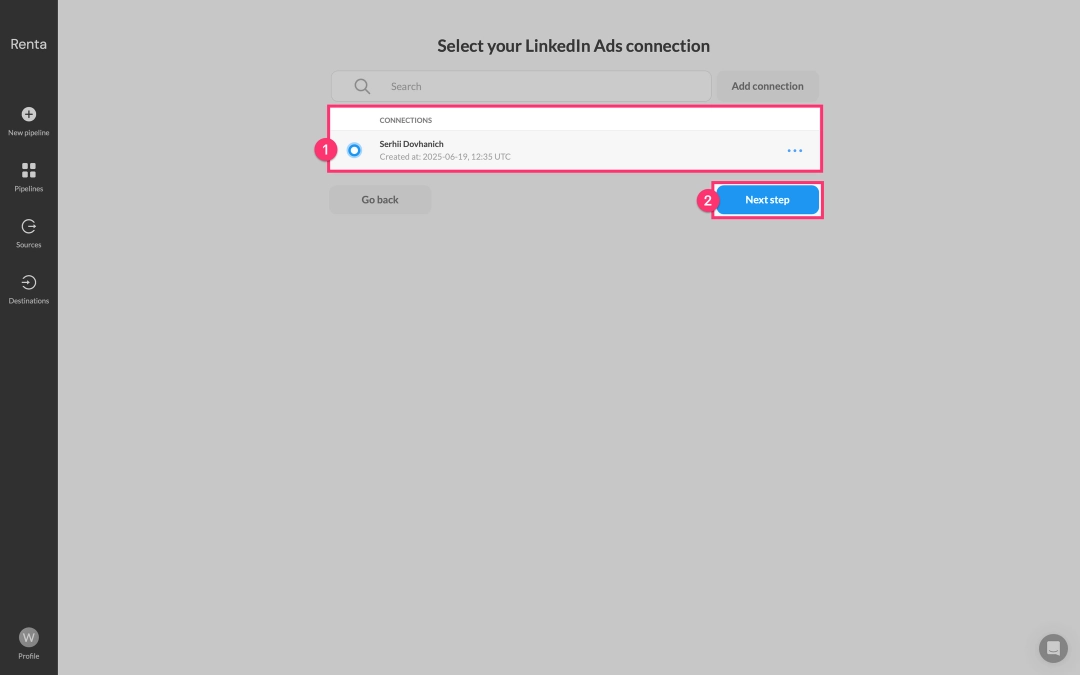
Next, from the list of available accounts, select the LinkedIn Ads account you added earlier.

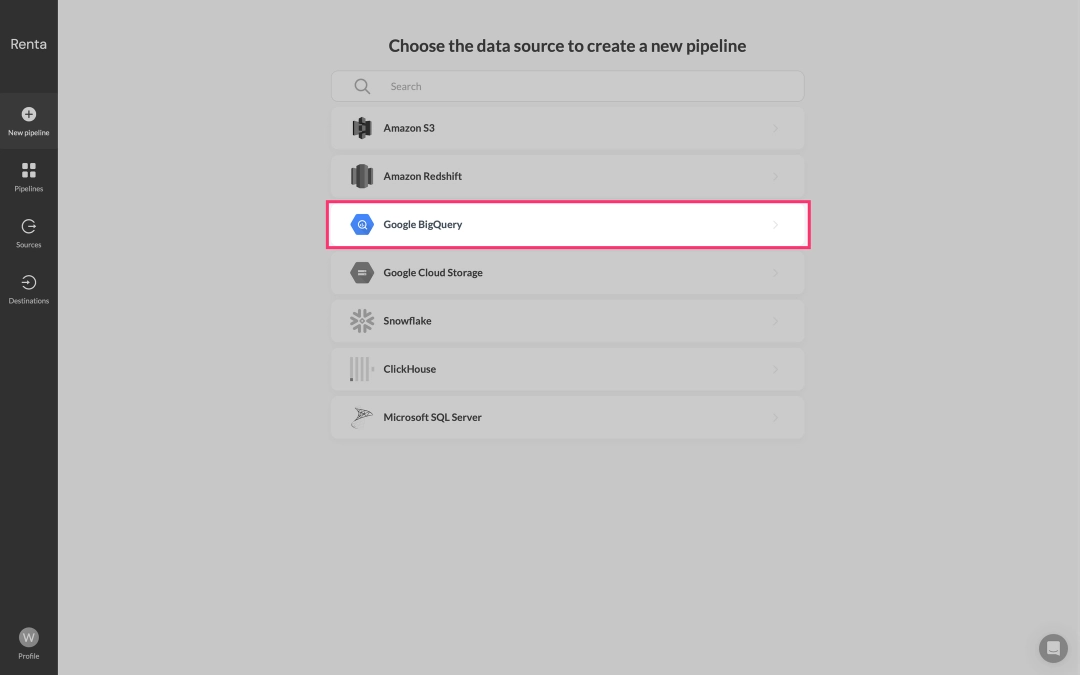
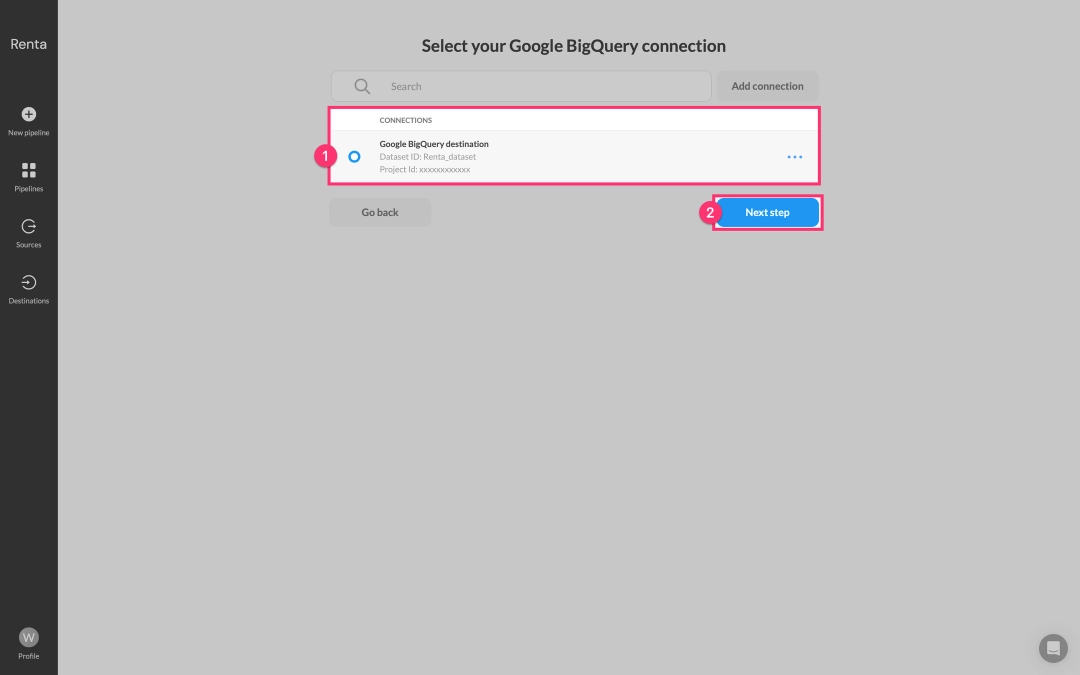
You'll then be directed to the catalog of available destinations. Here, select Google BigQuery.

Finally, from the list of available Google BigQuery accounts, select the project you added earlier.

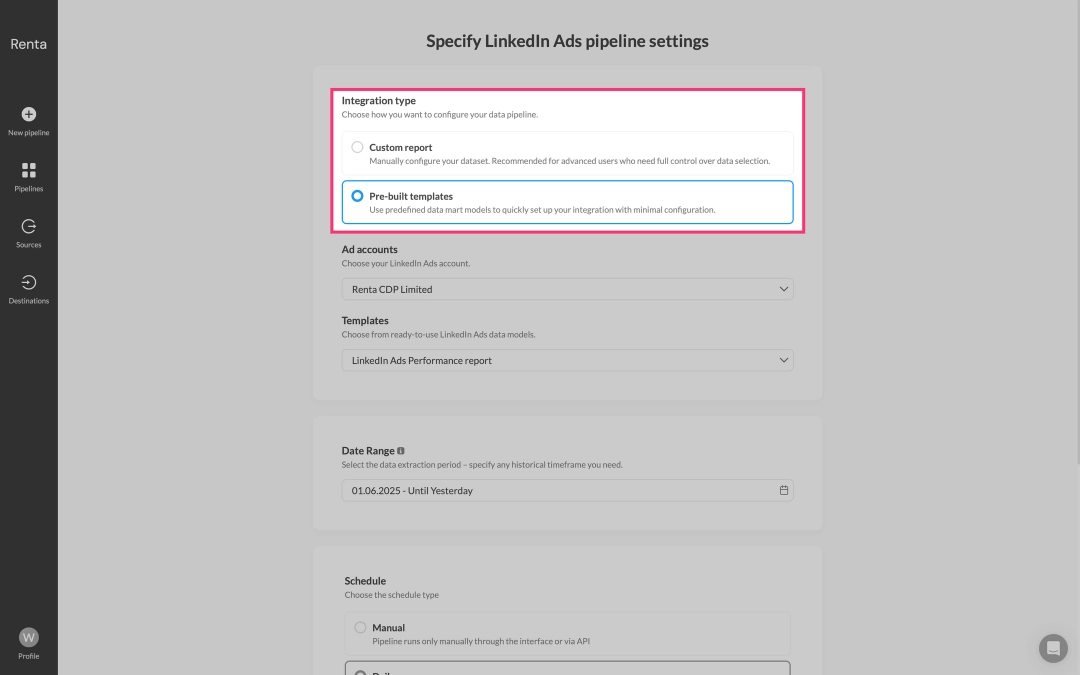
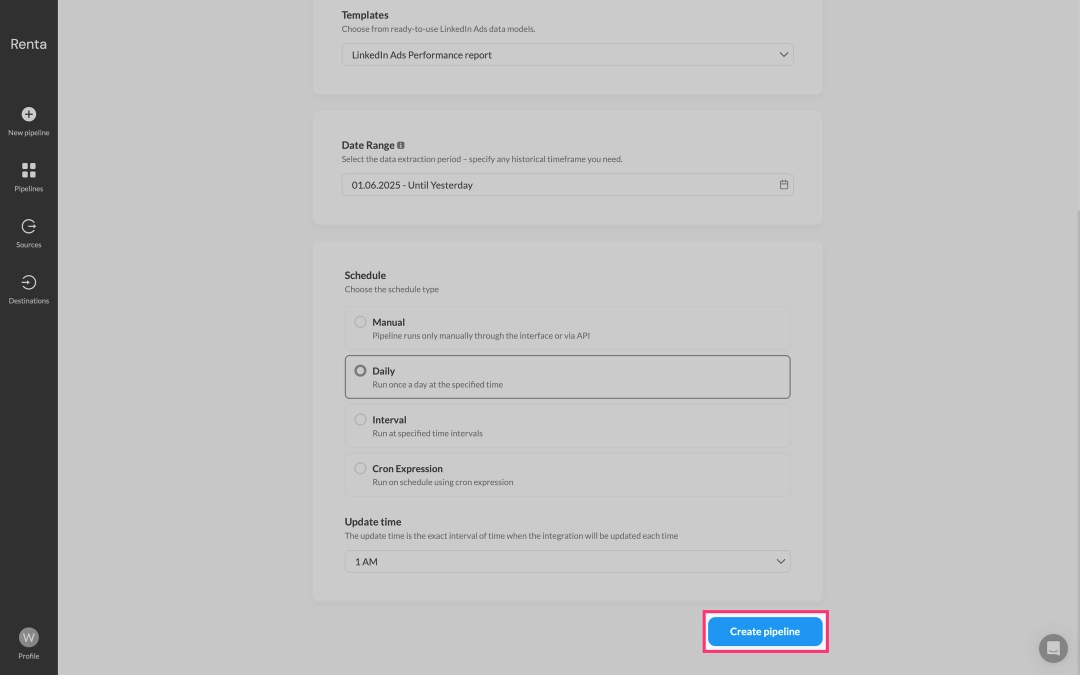
On the pipeline configuration page that now opens, in the Integration type field, select Pre-built templates.

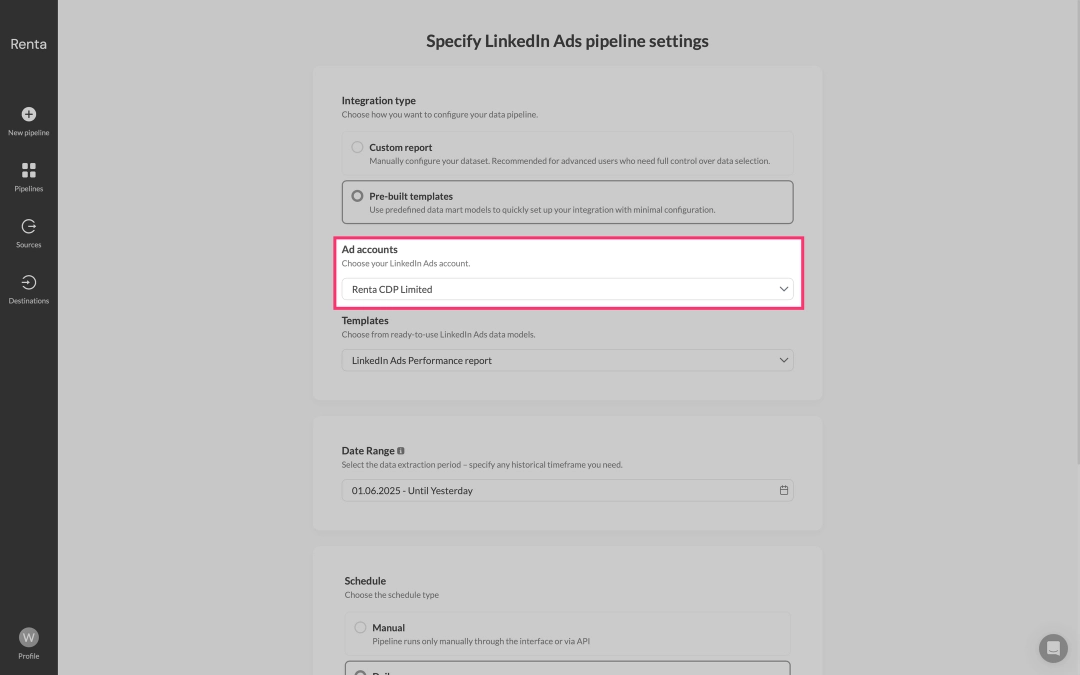
From the Advertising Accounts drop-down list, select the LinkedIn Ads advertising account from which you want to extract data.

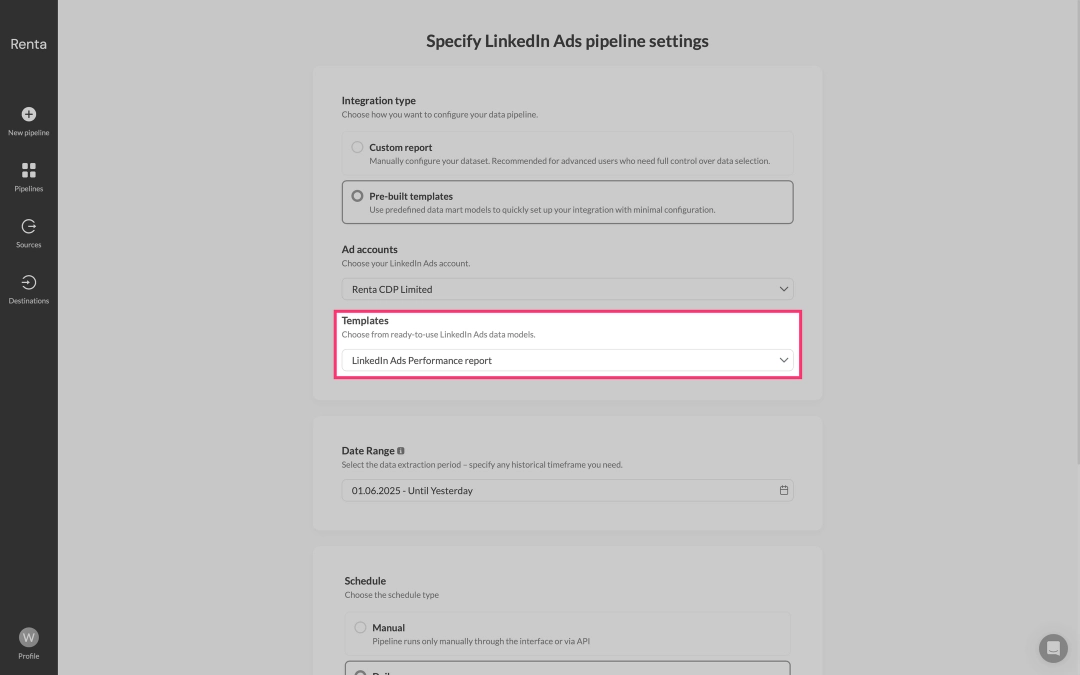
From the dropdown list of available templates, select LinkedIn Ads Performance Report. This template is specifically designed to address the problems described earlier in this article and includes the most popularly used metrics needed to measure the performance of advertising campaigns.

Finally, click Create pipeline.

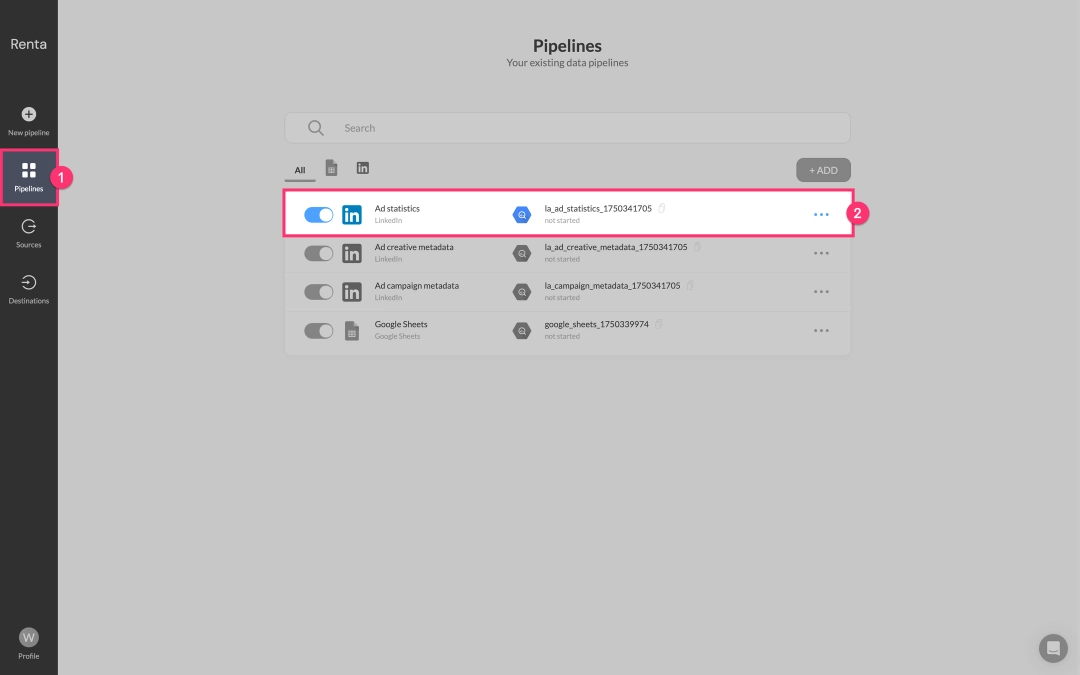
Done! Immediately after saving, Renta ELT will automatically create three linked data pipelines:
- One for exporting the main ad statistics report.
- Two additional ones for exporting metadata: Ad Creative and Campaign Metadata.
The integration is complete, but let's now look at a few options for customizing reports.
Customizing data schemas
Renta ELT's pre-built templates are a simple starting point that solves 90% of tasks out of the box.
However, we understand that enterprise teams may have unique data structure requirements. Therefore, Renta ELT provides the ability to modify table schemas for each data pipeline.
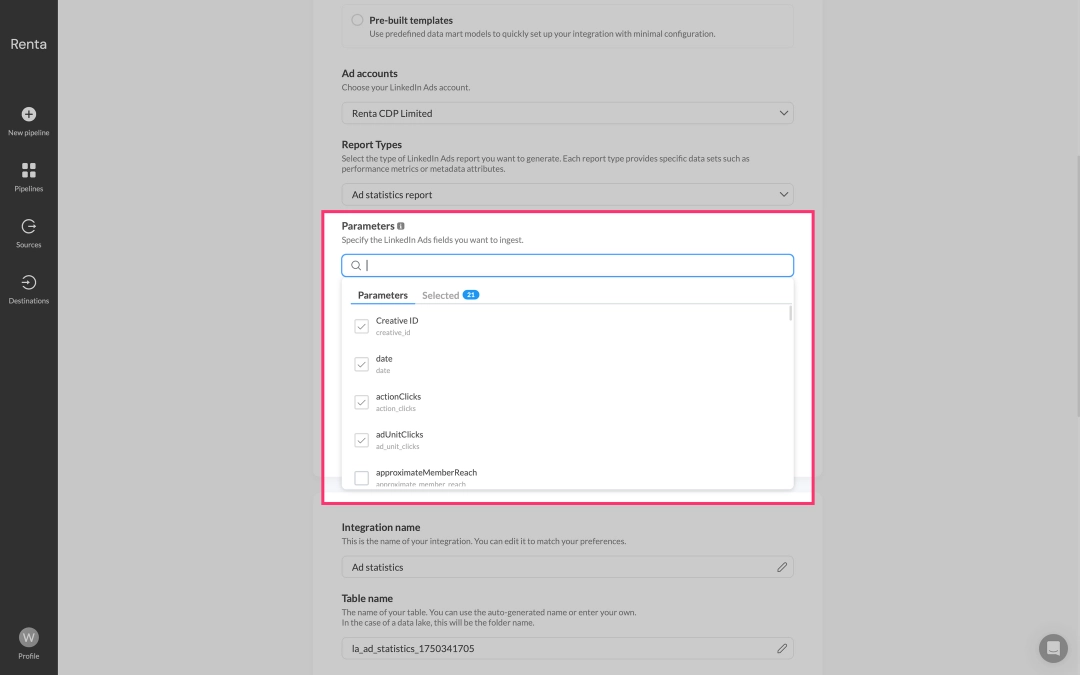
After creating a pipeline based on a template, you can easily customize it: add additional fields available in the LinkedIn Ads API, or remove those not needed for your analysis. This allows you to form a data schema fully adapted to your business needs.
In the Pipelines section, find the data flow you created earlier. For example, Ad Statistics.

Click the Edit icon (often represented by a pencil) next to the desired data flow to enter its configuration editing mode.

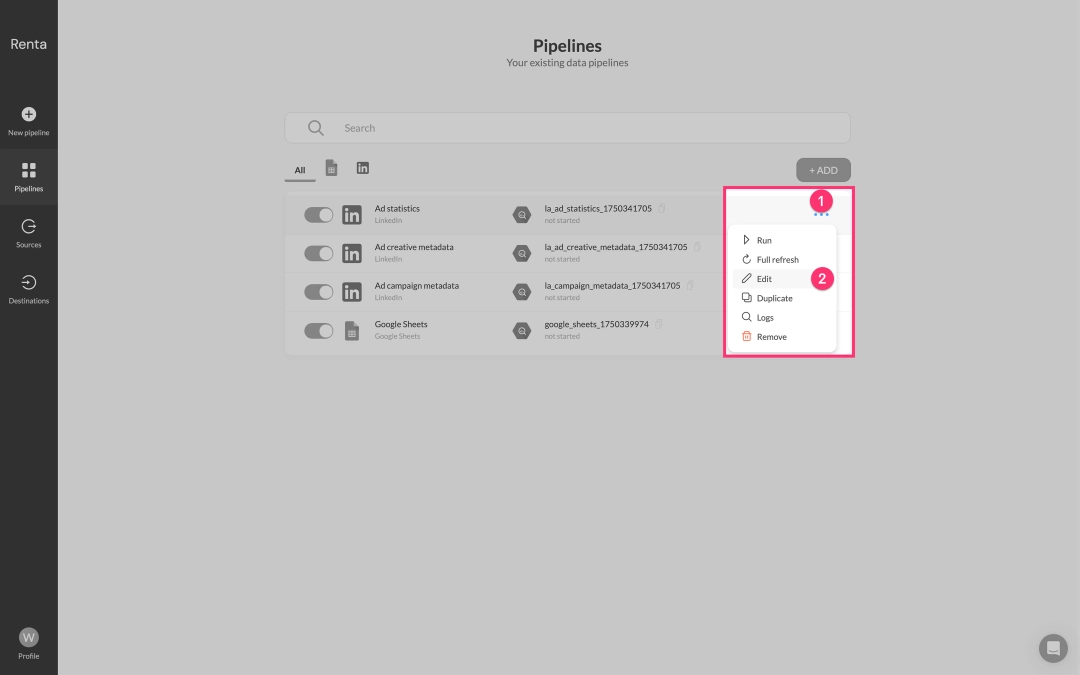
Within the Parameters block, you'll see a list of all available fields for export. Check the boxes for the fields you want to include in your reports or uncheck those you don't need.

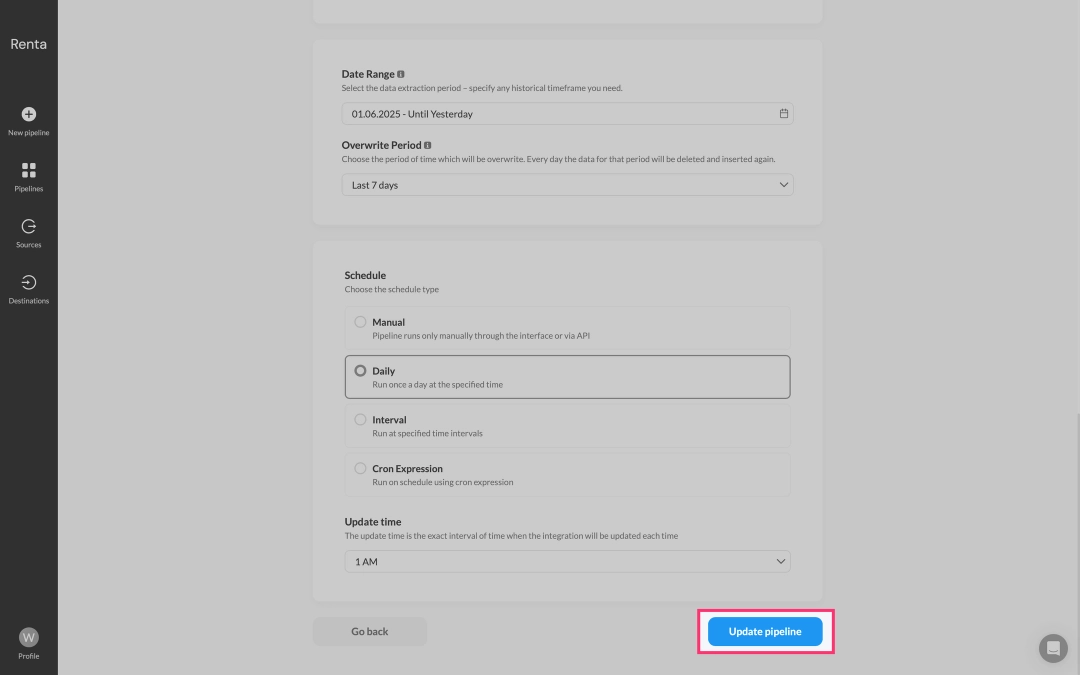
Click Update pipeline to apply your changes to the data pipeline's configuration.

Thus, you are not limited by the preset schema and can manage report details at the most granular level.
Automatic data refresh
Data reliability depends on its stable delivery to the data warehouse. Renta ELT allows you to configure refresh schedules for each pipeline individually, ensuring maximum flexibility and efficiency.
For example, you can:
- Update spend and click data (ad statistics) every 15 minutes to quickly track ad performance.
- Update campaign and ad metadata (ad campaigns, ad creatives) daily, as this information changes infrequently.
This approach reduces API load and optimizes ETL process costs.
Data refresh schedules are available in the settings of each data pipeline.


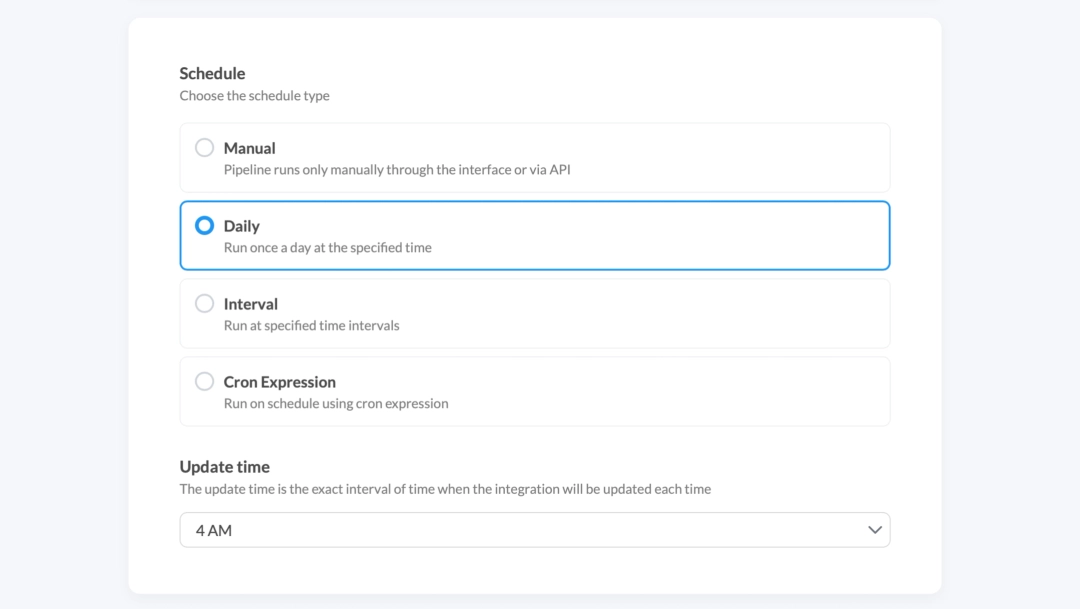
Renta ELT offers the following methods for schedule management:
| Schedule type | Description |
|---|---|
| Manual | Pipeline runs only manually through the interface or via API. Webhook triggers: for integration with external data orchestration systems like Airflow, and on-demand updates. |
| Daily | Run once a day at the specified time. For example, every day at 3 am. |
| Interval | Run at specified time intervals. From refreshes every 15 minutes to weekly synchronization. |
| Cron Expression | For complete freedom in setting up a custom schedule. For example, run at 3 AM on the first Monday of every month. |
Now, data from LinkedIn Ads will automatically refresh in your Google BigQuery project. In case of a data synchronization error, you will receive a notification via email or Slack channel.
Conclusion
Ultimately, you get a fully manageable, flexible, and reliable system for working with marketing data. Start with a free trial period to build your first data pipeline and personally evaluate all the benefits of Renta ELT.